Read the signals
Today’s post looks at a report from the FT on how to use the sentiment in its news stories to trade financial markets.
Contents
Read the signals

The report has been written for the FT by Saeed Amen, Founder of Cuemacro.
The premise of the report is that automated signals can overcome the problem of information overload:
Using news to trade financial markets is not new but today there is simply too much of it for any human to read.
There are countless instances where Financial Times reporting has caused market prices to jump, but what if we were to apply quant methods and machine learning to distil the message of what is written in the FT in a systematic way?
To explore this opportunity, the FT has made its news feeds machine-readable. (( Unfortunately, but also unsurprisingly, this coded feed is not free ))
- The report uses these feeds to trade S&P 500 futures.
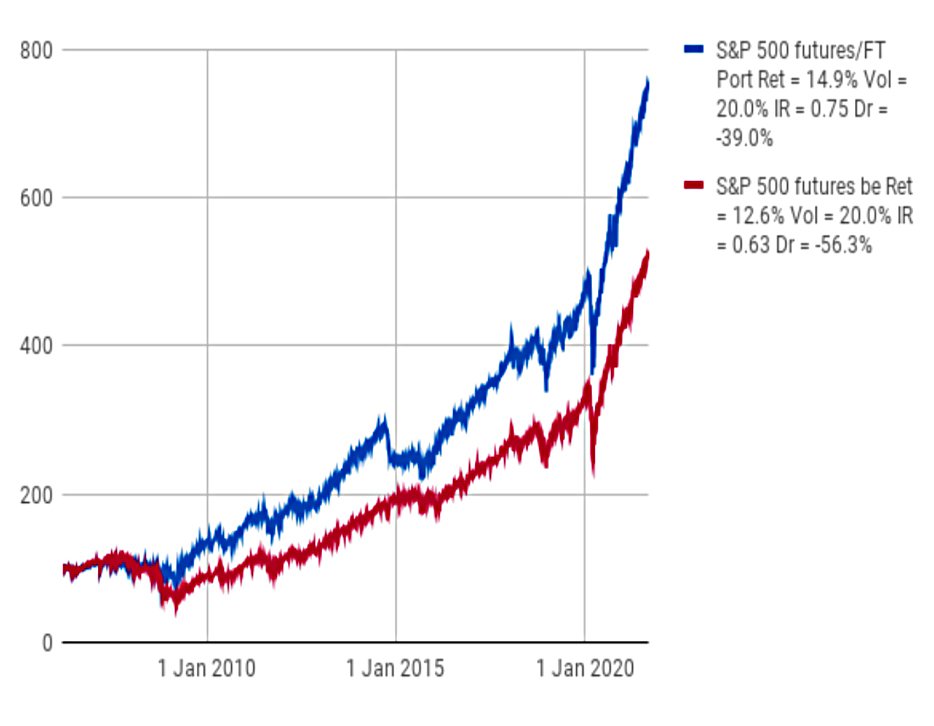
The strategy had a Sharpe ratio of 0.75 since 2006, compared to 0.63 for buy and hold.
- The max drawdown was also smaller (39% vs 56%).
The dataset
The dataset goes back to 2005 on a daily basis, with intra-day timing added in 2018.
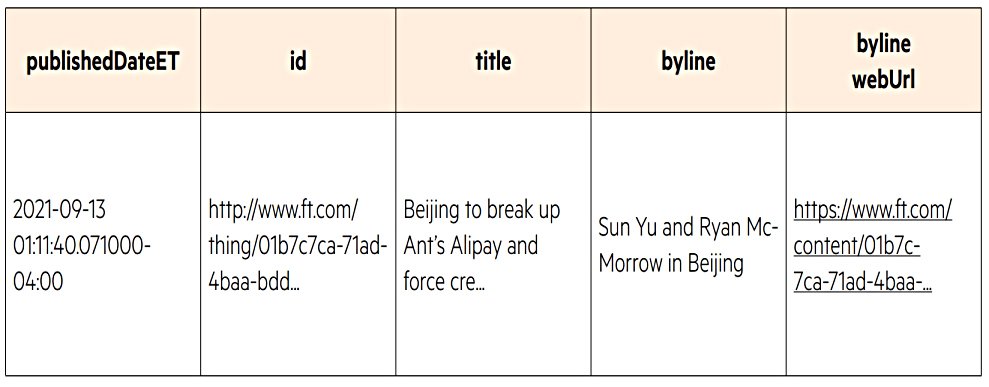
The data is in JSON format:
- Published date/time
- Title of the piece
- Byline
- Body text of the article
- Location – e.g. UK
- Topics – e.g. US economy
- Organisations – e.g. JP Morgan
- People – e.g. Joe Biden
The tags depend on whether the article is;
- “about” a certain topic/entity
- just a “mention”
- “implicitly about” the topic
Data is also linked to equity tickers (in “industry standard” FIGI format).
Saeed explains how the data is processed:
We need to use our knowledge about the market to select those topics which are most important for the asset we are analysing. The body text is cleaned, removing any HTML tags and natural language processing is applied to the cleaned body text to create a sentiment score.
The news was used for days rather than intar-day trading:
We’ll aggregate news on a daily basis, with a cutoff at the New York close. The objective is to create metrics and indices that are aggregated over windows of several weeks that can be useful for longer-term investors.
Global macro
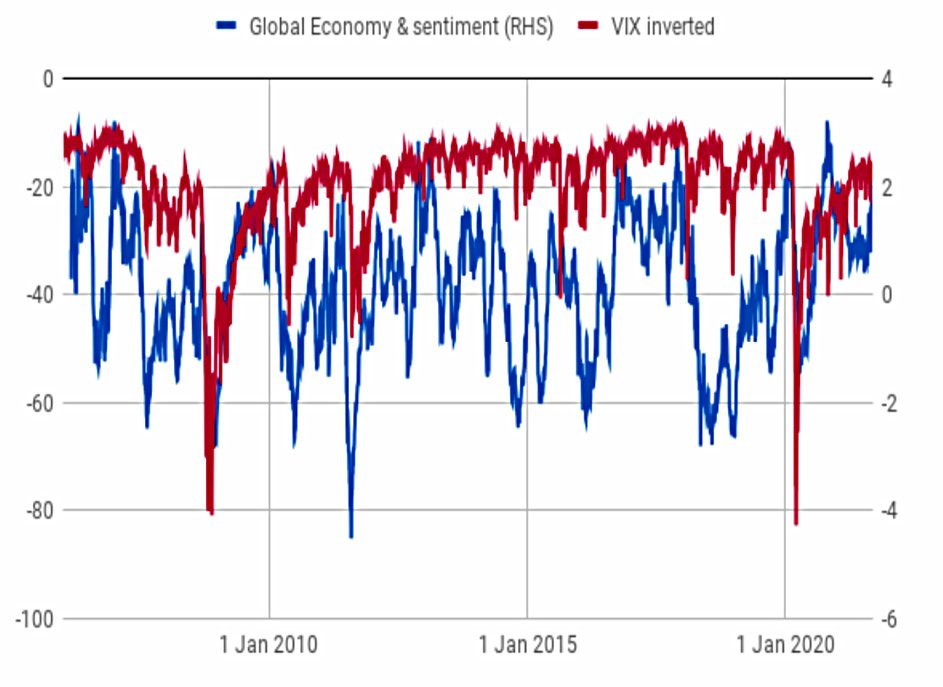
The first example in the paper is a global economy macro index.
We aggregate the sentiment within a 3 month window, and convert it into a Z score.
The Z-score measures how many standard deviations the current value is from the mean.
- The graph plots the sentiment index against the inverted VIX.
The largest spikes in our sample of VIX occur in 2008 during the financial crisis and in 2020 off the back of the coronavirus selloff. During both these periods, there was a considerable decline in sentiment associated with FT stories tagged with the global economy topic.
Which is what you would expect.
- But it’s not immediately clear to me that the sentiment index is a leading indicator, and it looks much noisier than the VIX.
Dollar volatility

Next up is dollar volatility against a count of articles written about the dollar.
Broadly speaking the number of news articles written about the dollar is coincident with the implied volatility of the dollar.
This equates market interest in an asset to volatility to articles, but once again it’s a noisy signal.
Inflation
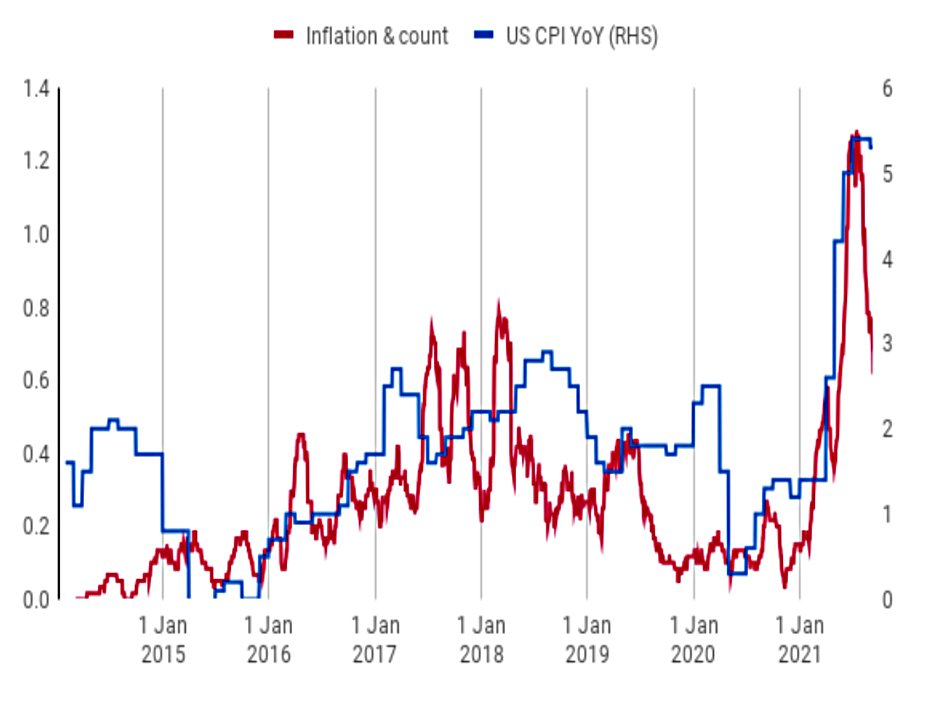
Mentions of inflation are linked to US CPI.
Employment
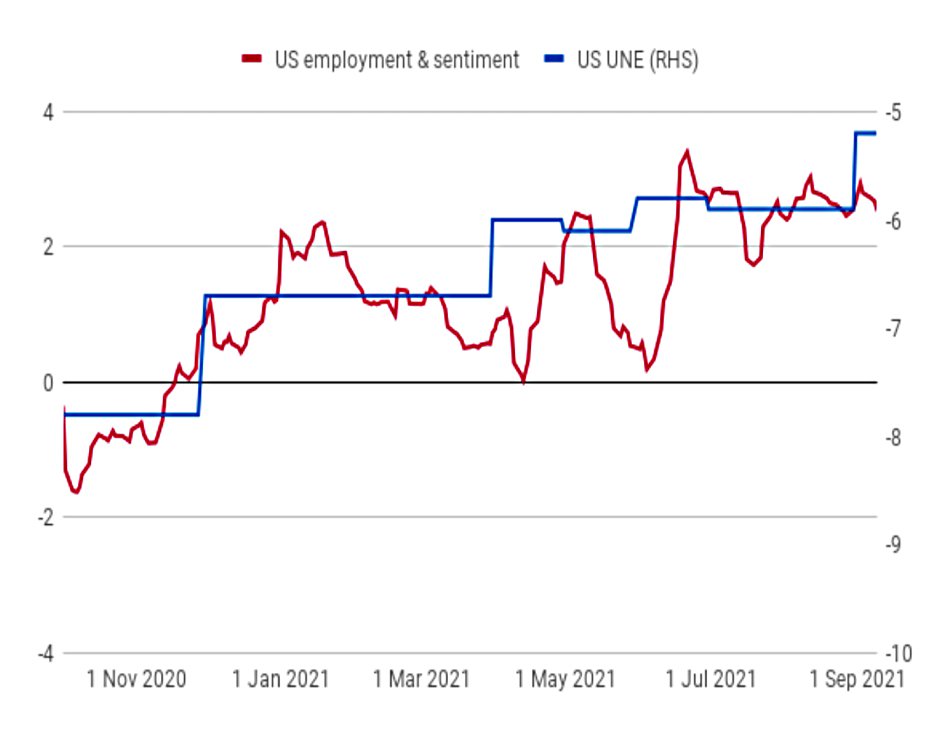
For US employment, we switch back from a raw count to a net sentiment index, aggregated over “several” months and converted into a Z-score.
Sterling
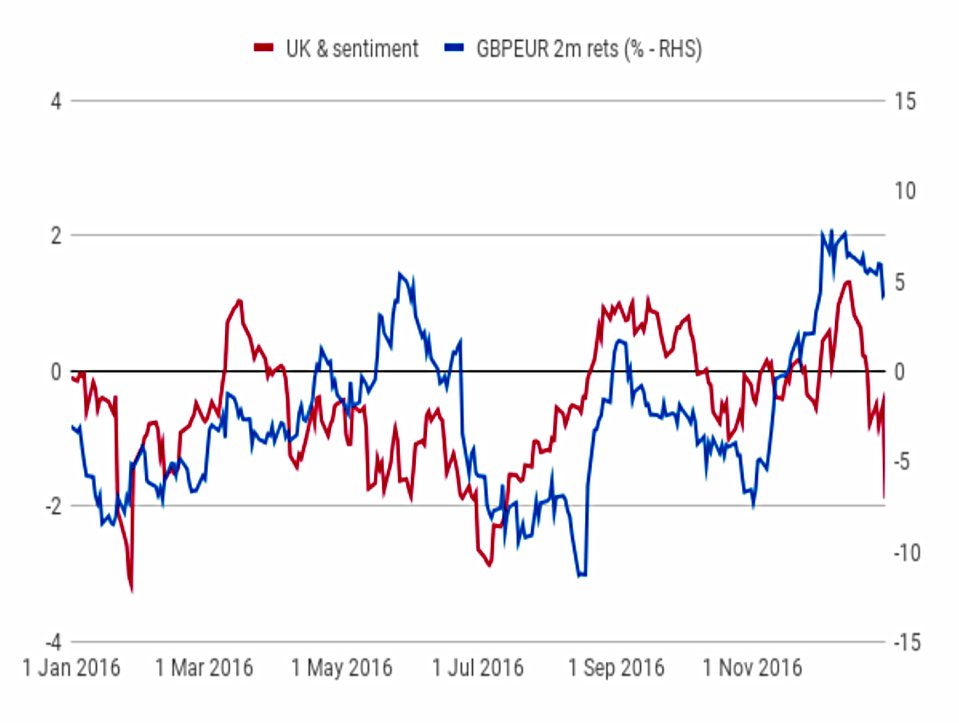
The next chart plots net UK sentiment against 2-month GBPEUR returns (around the time of the Brexit referendum).
FT writers
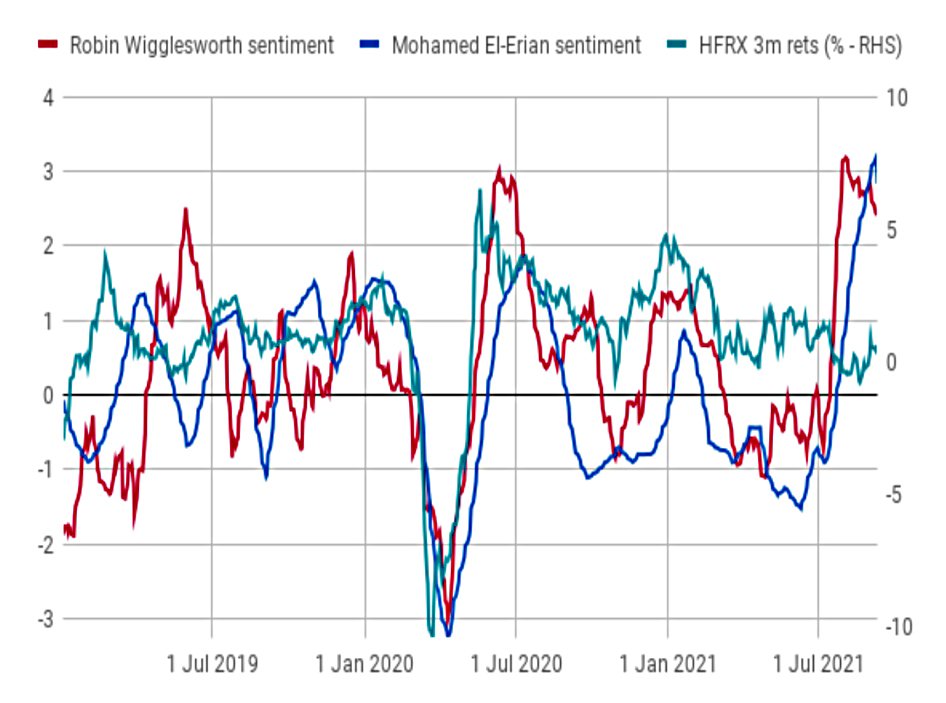
This one plots a couple of individual FT writers against three-month hedge funds returns (including the period of the Covid crash).
Trading
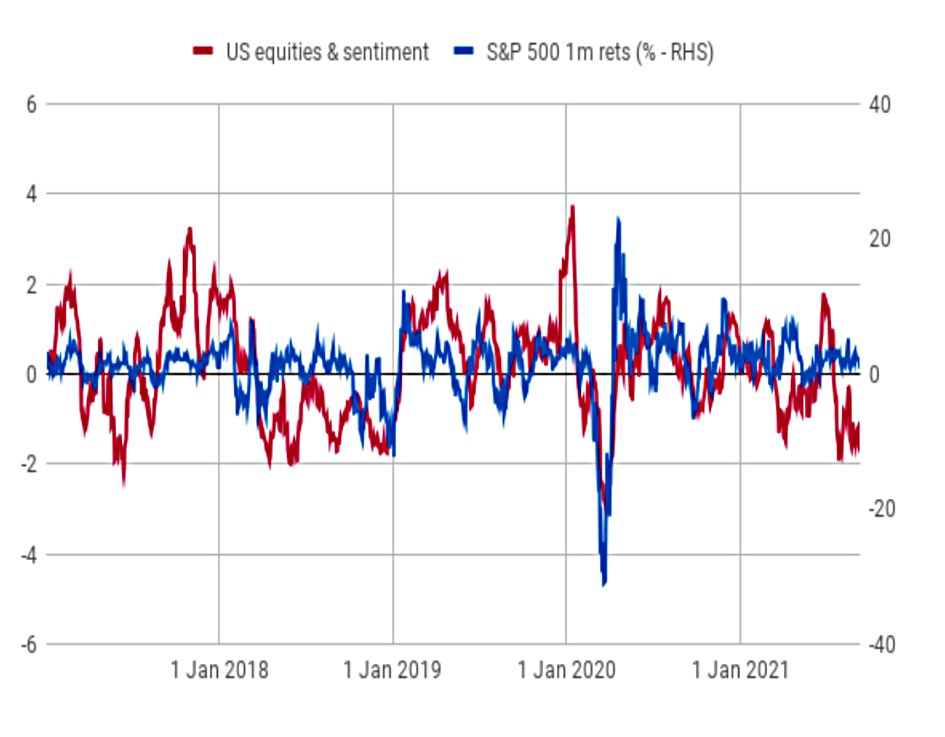
The paper wraps up with a more detailed look at the trading strategy it tested.
- This chart shows US equities sentiment (1 month Z score) against S&P 500 1-month rolling returns.
There looks to be a good correlation here, so Saeed adds a trading rule:
We’ll be trading S&P 500 Emini 1st dated futures. When our sentiment Z score indicator is below -2, we go short S&P 500 futures. At other times we remain long S&P 500. We can see that the signal is mostly long, and has only occasionally gone short.

We’ve seen the cumulative returns already, but here’s an annual comparison to the benchmark.
That’s it for today.
- Saeed has demonstrated a decent number of relationships between news sentiment and market movements.
It would be interesting to see whether this approach would work with individual stocks in the S&P 500 and/or the FTSE 350.
- But since the data feed is not free, I guess we’ll have to leave it there.
Until next time.
Mike Rawson
Mike is the owner of 7 Circles, and a private investor living in London. He has been managing his own money for 40 years, with some success.