Weekly Roundup, 14th February 2017

We begin today’s Weekly Roundup in the FT, with the Chart That Tells A Story. This week it was about spending up to the age of 50.
Contents
Spending before age 50

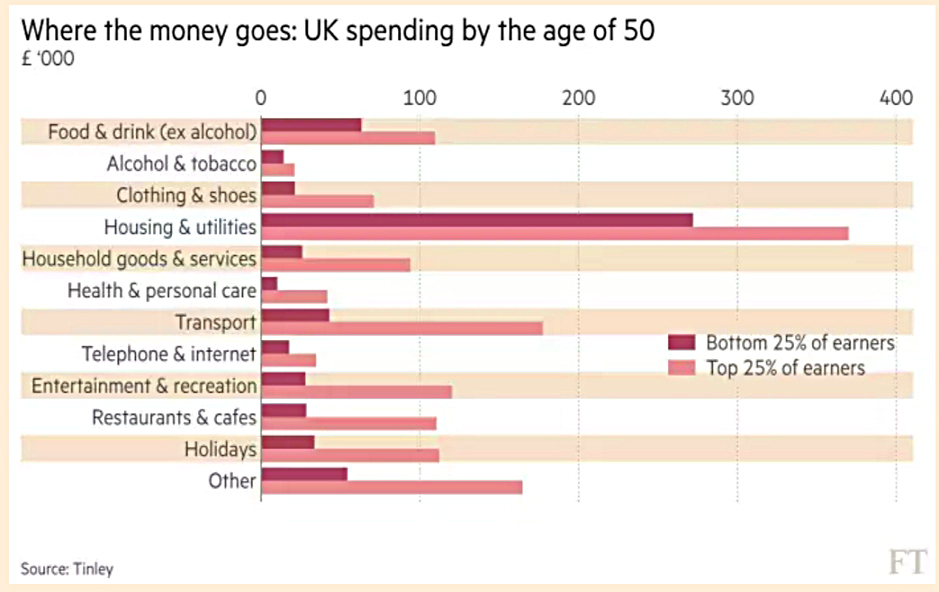
Lucy Warwick-Ching looked at spending patterns up to the age of 50, comparing the highest-earning quartile with the lowest-earning one.
- The (not very surprising) finding was that richer people spend more on drink and clothes than poor people.
By the age of 50, the average household has spent £1M.
- Top earners have spent £1.4M, with £342K of that on leisure activities.
After age 50, the average household will spend another £1M, spread over 25-30 years.
The average lifetime total is £1.9M.
- Top earners spend £2.8M over their lifetime.
The pattern through life is that spending rises with income, peaking between 30 and 49.
- Housing takes up a steadily smaller share of the budget with age.
- And leisure (including holidays) increases after the age of 65.
All this data comes from a report by Tilney – based on ONS data – called “The Cost of Tomorrow”.
- Tilney’s key point is that while people believe that their standard of living will be maintained or increased in retirement, they are underestimating the amount of money that they will want to spend.
The average household expects to spend £16.5K pa, but will spend £26.5K between the ages of 65 and 75.
- The top earners will spend £43.3K pa.
NS&I slashes rates
Lucy also reported that NS&I is cutting interest rates.
- This is particularly annoying to me as I had just researched savings accounts for my mother-in-law.
- More on this in a future post.
Lucy’s focus was on Premium Bonds, but in fact they get away relatively lightly.
- The effective average interest rate (( The actual rate varies with the amount of money that you invest )) was cut from 1.25% to 1.15%.
- Other NS&I accounts went down by up to 0.25% pa.
Compared to other non-ISA savings accounts, Premium Bonds still look ok to me.
Social care funding

Hugo Greenhalgh reported on discussions in the House of Lords on how social care could be funded.
- Options included compulsory saving (( I would make workplace pensions compulsory, and double the planned ceiling on contribution rates from 8% to 16% pa )) and some kind of pooled risk product (insurance).
Germany and Japan have systems that step in when a person has been unable to live independently for six months, but here in the UK, insurance has been tried before.
- Long-term care plans were on sale more than a decade ago, but did not catch on.
I think that most people expect the state to care for them, but that doesn’t happen at all until your total assets fall below £23K, and doesn’t happen completely until you have less than £11K left.
- There’s also the problem that the coming bulge in over-85s needing care are already aged over 65.
- It’s too late for them to contribute to new products.
Baroness Ros Altmann has called for a “Care ISA”, though it’s not clear to me what the incentives to save would be with this product.
- Saving for one specific purpose only will be unattractive compared with spending for general purposes (in a SIPP or a regular ISA).
I think she wants to see the 25% government bonus carried across from the new LISA.
- That makes a difference to basic rate taxpayers, but higher earners (the ones most likely to be able to save towards care) would still be better off paying into a SIPP.
Ros has also suggested that a portion of a pension pot could be set aside tax-free to pay for care.
- If you didn’t use it, your partner could instead.
- That might work for some people – including me, assuming that the definition or partner was extended to include non-married people.
Social investment

Vanessa Houlder reported that the tax break for social investment will be increased by a factor of five in April.
- The limit for Social Investment Tax Relief (SITR) will increase from a three-year rolling limit of £293K to £1.5M.
SITR is similar to the tax relief on VCTs – you get 30% of your contribution off your income tax bill.
- The difference is that you are usually lending money to the underlying charity or community group, rather than buying an equity stake in it.
- The average interest rate is only 4.8% and for the first three years, none of the capital needs to be repaid.
The investments can’t be marketed to the public at the moment – only “sophisticated” investors qualify.
I haven’t come across any funds myself, though the article mentions two:
- Resolution Bristol fund
- Bright Futures STR fund
- Social Finance and Social Investment Scotland are also mentioned as providers.
The sector is tiny at the moment – only £3.4M was invested in the first two years – and raising the limit to £1.5 may not be enough.
- A single large fund backed by a solid brand name in VCT, EIS or private equity is probably what’s needed to take this investment mainstream.
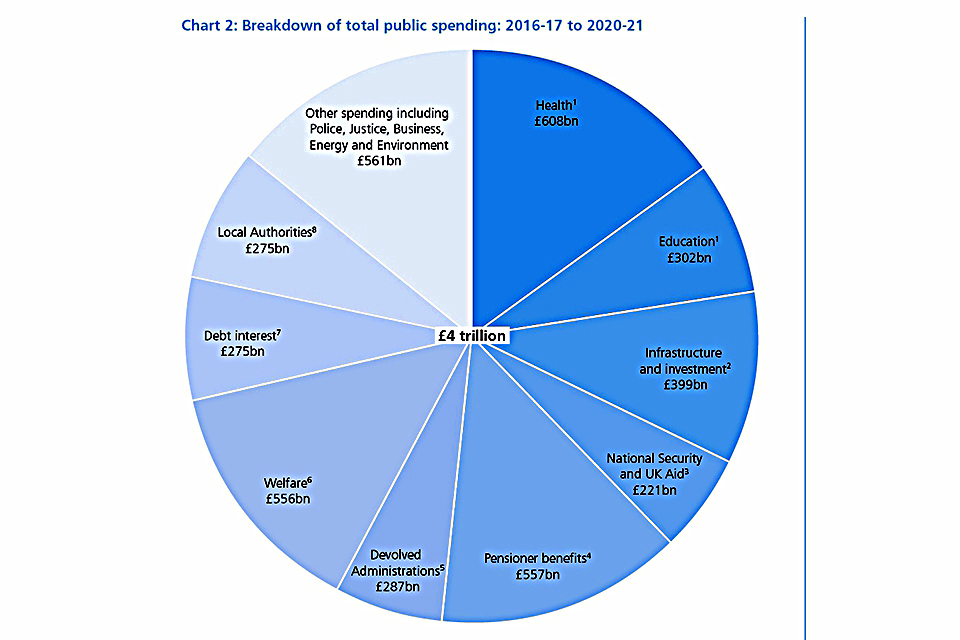
Tax burden

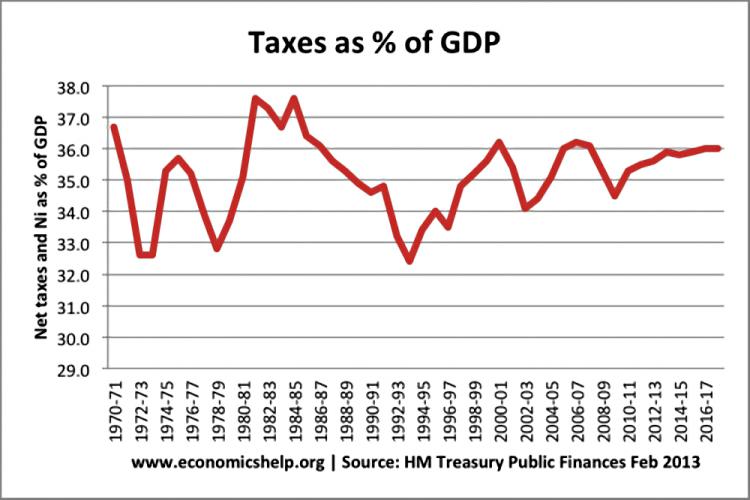
Gemma Tetlow reported that the UK tax burden will reach it’s highest rate for more than 30 years later in the current parliament.

Despite “austerity”, the tax take will move above 37% of GDP.
- Sadly, spending remains above 38% of GDP, despite extensive cuts since 2010.
We’ve talked about this before, but we have a big problem here.
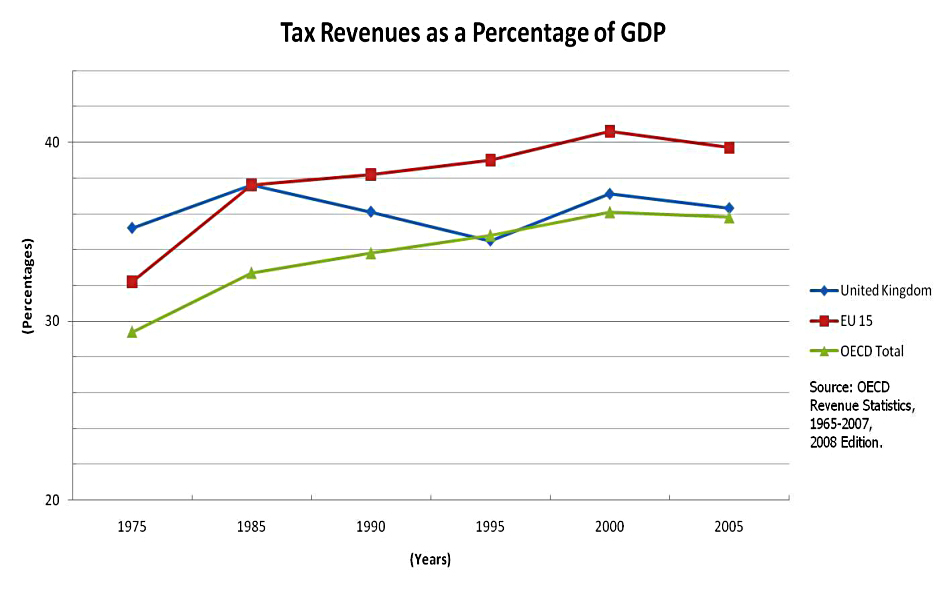
- Raising the UK tax take from its current level has proved impossible historically.
Those calling for extra money to shore up the NHS (for example) need to look at the other side of the equation.
- What should we spend less on?
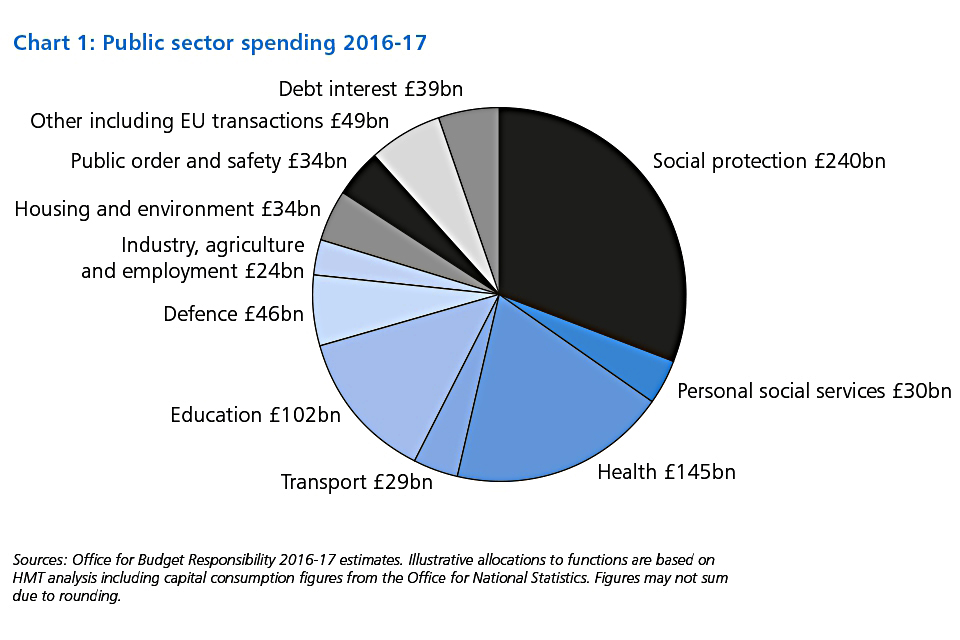
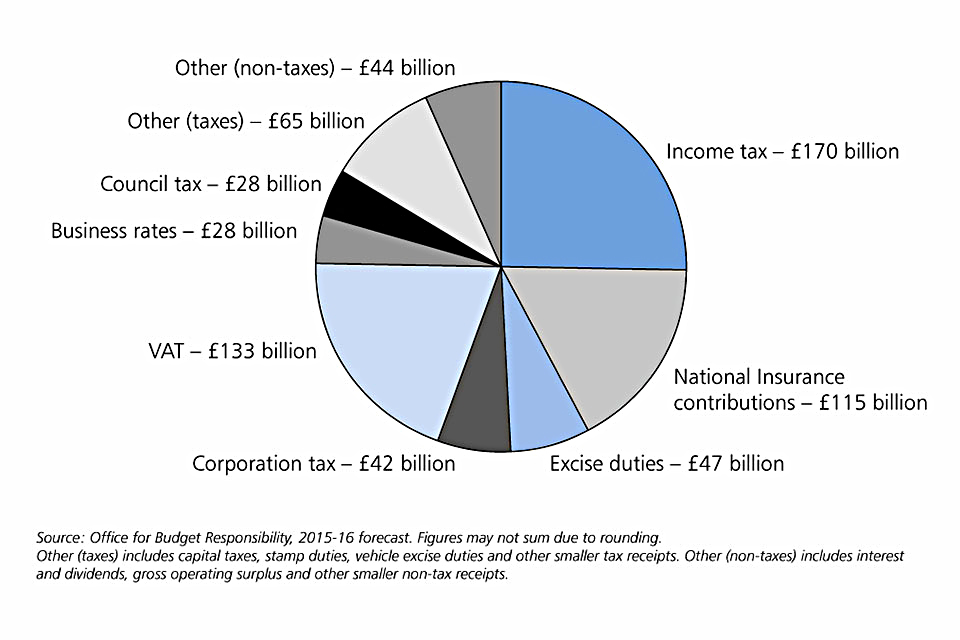
The UK budget goes mainly on pensions, health, welfare and education.
- Which of these areas would people like to see less of?
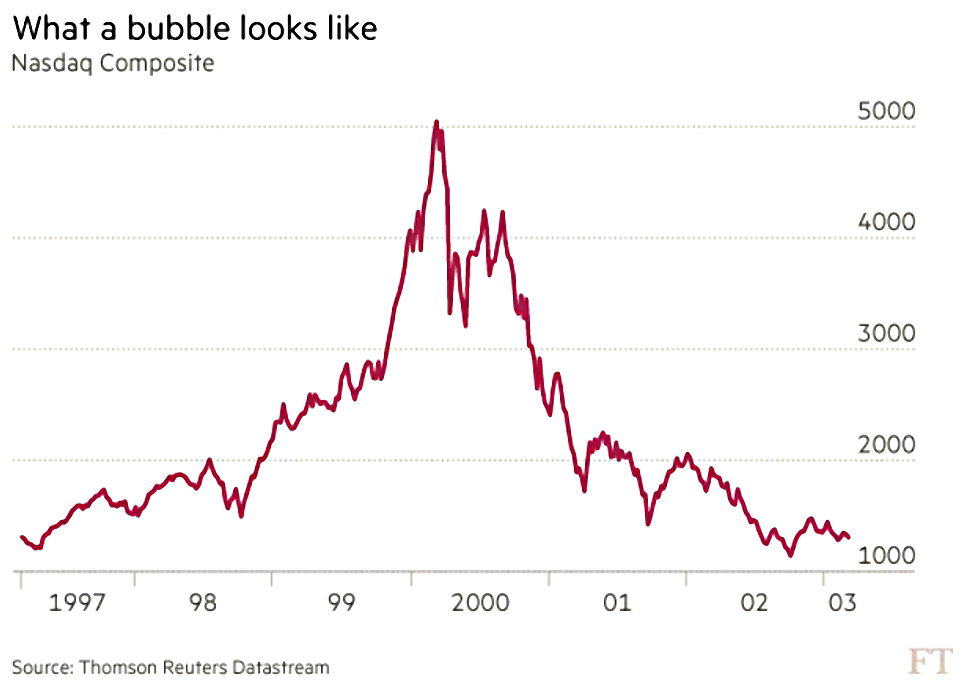
Bubbles

John Authers looked at market bubbles, and whether there really was any such thing.
- Given the dot-com bubble of 2000, and the US sub-prime housing bubble of 2007, most people would be pretty confident in answering yes.
- The real question is can you spot them in advance?
John has been reading a new book called “Financial Market History: Reflections on the Past for Investors Today”, by David Chambers and Elroy Dimson.
- The contributors to this compendium argue that because there are very few bubbles in history, it’s had to use them to make predictions.
[amazon template=thumbnail&asin=1944960139]
Even defining a bubble seems difficult.
- The one thing that all the famous bubbles have in common is that they burst.
Maybe a better way is to look at bubbles that didn’t burst, and to work out why.
- But this doesn’t make things any easier.
William Goetzmann from Yale defines bubbles as “booms that go bad” – but that doesn’t mean that all booms are bad.
- He defines a boom as a doubling of prices within three years.
- He wanted to use doubling in one year, but that ruled out the dot-com boom and the 1929 bubble.
- A bubble is a boom that subsequently halves (goes back almost to where it started).
Goetzmann’s first point is that there is usually a fundamental basis to a bubble – canals, railways, the internet.
- This creates confusion about future value creation.
- Things end up very expensive, but the origin is not stupidity.
His second finding is that crashes back to the starting level of a boom are rarer than booms where prices double again after the boom is identified.
Using his tight definition of doubling in a year, he found 72 booms.
- This happened just 2% of the time (he was studying 21 stock markets back to 1900).
Six doubled again the next year, and only three halved (went back to where they started).
- All of the halvings were in small economies (Argentina, Austria, Poland).
His looser definition produced 460 bubbles – this was 14% of the time.
- 10.4% of these 14% (ie. just 1.4%) halved within the next five years.
- 6% of the 14% (0.8%) halved within three years (ie. at the same rate as the doubling).
So most booms don’t crash, and it’s dangerous to exit the market after a rise.
- A sharp rise in value is more of a buy signal than a sell signal.
Timing the market on extended valuations doesn’t work. (( At least on a simple in / out basis – there are more measured ways to exploit valuation ))
- Which is not to says that buying things that are obviously expensive will always work out either.
John comes out in favour of rebalancing.
- This way you are automatically taking profits as markets rise.
Over the Economist, Buttonwood looked at the same book, focusing on how to recognize a bubble.
- He started with the same Goetzmann article we just looked at.
GMO used a more technical definition of a bubble than Goetzmann:
- When the price of an asset rises by more than two standard deviations above its previous long-term trend.
- Interestingly, this is the definition of a Bollinger band, though these are normally applied to much short-term averages.
In another chapter, Antti Ilmanen of QPR Capital Management used a third approach:
- the cyclically adjusted price earnings ratio (CAPE), which averages profits over ten years.
Buying US equities when they are cheap returns 13% pa over the following decade.
- Buying when they are expensive returns just 3.5%.

The problem is that what is cheap is only available with hindsight.
- The ratio is also not much use over the short-term.
- The CAPE regularly makes the US market look expensive, as it did for most of the 1990s, not just the 1999 peak.
Using only the “available at the time” CAPE information would have slightly outperformed buy-and-hold since 1900, but it would have underperformed for the past 50 years.
- So neither a rapid doubling of the market nor a high valuation are reliable sell signals.
Buttonwood isn’t surprised:
- if we could tell when the market was getting too expensive, then the big swings wouldn’t happen at all.
ISA best buys
The Telegraph gave its take on the best (cheapest) place to buy an ISA.
They looked at eight portfolio sizes:
- £5K, £15K, £25K, £50K, £100K, £250K, £500K and £1M.

Only two providers scored well at all sizes – iWeb and ClubFinance.
- Other winners for larger portfolios (£100K and over) included AJ Bell YouInvest, Hargreaves Lansdown, iDealing, Interactive Investor and Selftrade.
Pensioner incomes
The BBC, which is rapidly becoming a pressure group for millennials, reported that pensioner incomes are now higher than those of working age people.
- A report from the Resolution Foundation called “As Time Goes By” found that they now have £20 a week more than workers, compared to a £70 a week deficit in 2001.
Those already retired in 2001 have only seen their incomes rise by 7%, compared to a 30% rise for pensioners overall.
- Instead, the change has been driven by newer, richer pensioners joining their ranks.
Nor is it true that all pensioners are doing well.
- Some have generous DB pensions that are no longer generally available, while others rely on the state pension which pays out £8K pa at most.
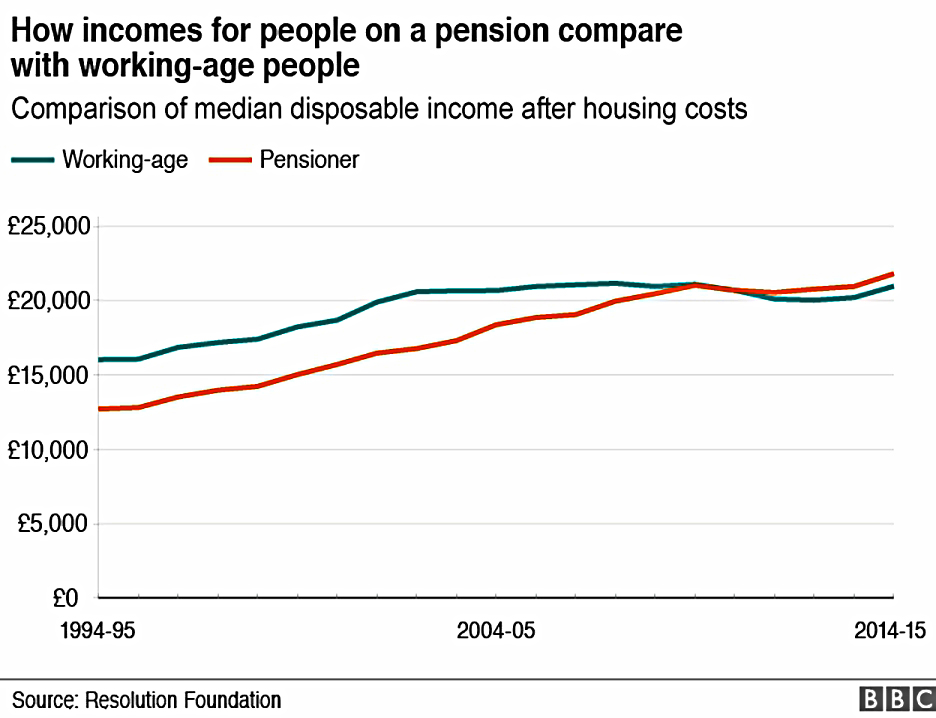
Although not mentioned in the original BBC article, (( They’ve updated it now )) the report looks at income after housing costs are taken into account.
- This means there is another factor to take into account – most current pensioners own their own homes and will not be paying rent or mortgage interest.
It’s not that surprising that a generation with DB pensions and houses have more money left to spend at the end of the week than those saving for pensions and paying for housing.
- If they didn’t, something would be wrong.
This permanent change in the structure of society matters more than the temporary difference between generations driven by the withdrawal of “privileges” that existed in the past.
- Because those privileges aren’t coming back.
A few links
And finally, a few of the links that I’ve tweeted out this week:
[contentcards url=”http://blog.alphaarchitect.com/2017/02/08/greatest-stock-picker-of-all-time-buffett-or-lynch” target=”_blank”]
[contentcards url=”http://aswathdamodaran.blogspot.co.uk/2017/02/apple-greatest-cash-machine-in-history.html” target=”_blank”]
[contentcards url=”http://www.economist.com/news/finance-and-economics/21716618-pillar-global-financial-stability-under-threat-donald-trump-and-dollar” target=”_blank”]
[contentcards url=”https://www.ftadviser.com/investments/2017/02/13/potential-closet-trackers-named-and-shamed/” target=”_blank”]
[contentcards url=”https://sharesoc.wordpress.com/2017/02/12/fca-reviews-open-ended-funds-with-illiquid-assets/” target=”_blank”]
[contentcards url=”https://blog.thinknewfound.com/2017/02/anatomy-bull-market/” target=”_blank”]
You can find more like these on my link archive pages.
Until next time.
Mike Rawson
Mike is the owner of 7 Circles, and a private investor living in London. He has been managing his own money for 40 years, with some success.