Weekly Roundup, 21st December 2020

We begin today’s Weekly Roundup with …
High multiples

Following on from last week’s discussion of Schiller’s new “CAPE yield”, John Authers looked at work by Gerard Minack on whether low interest rates should lead to higher PEs.
- Minack says no – low interest rates usually mean that growth is low, which is bad for equities.
That leads to a curved relationship between rates and equities over time — when rates come down from very high levels, equity multiples tend to improve, but when rates then drop to very low levels, equity multiples fall because this generally means that the economy is mired in a recession.
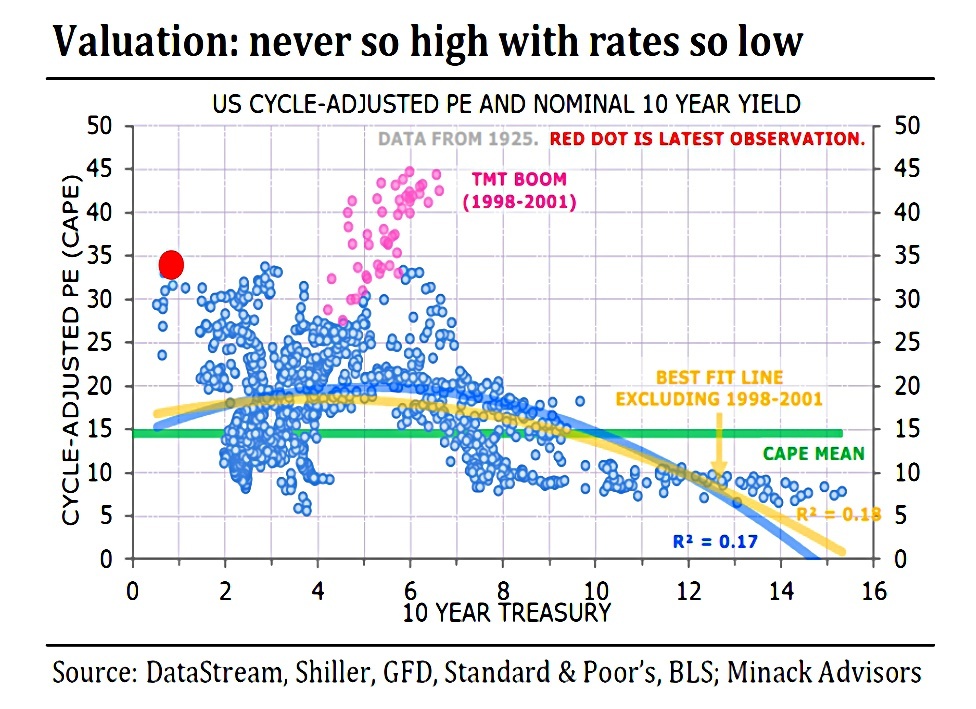
The relationship between the CAPE and the nominal 10-year yield is weak (R2 = 0.12).
- The pink dots are the dot com bubble, with high PEs for the prevailing interest rates.
The current red dot also looks expensive, but there is less data here.
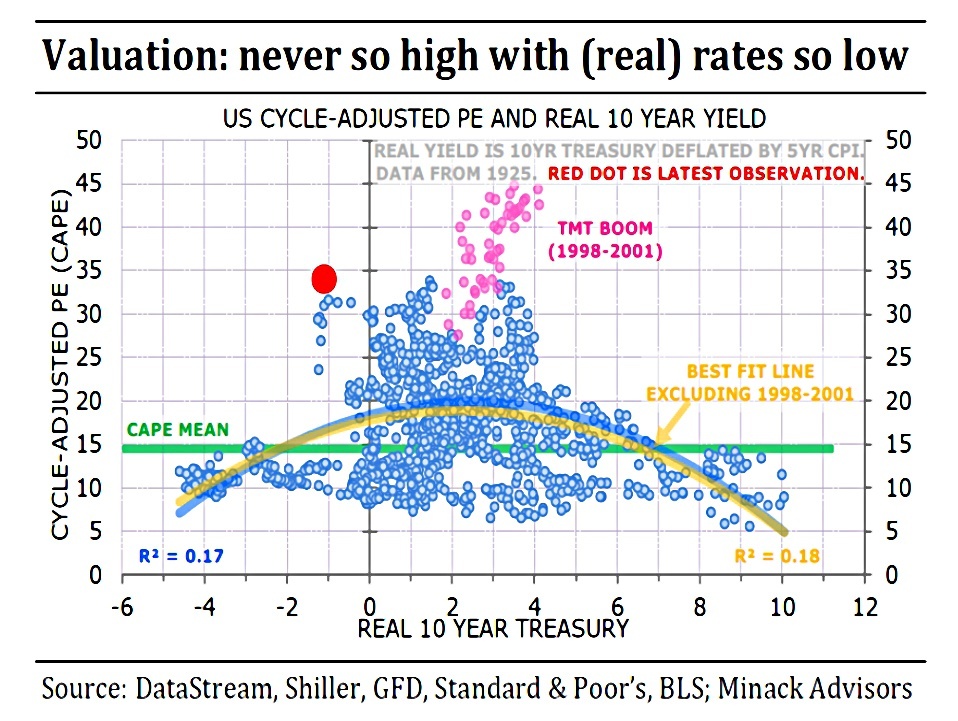
Switching to real yields makes the current environment less extreme, and improves the correlation a bit.
- It also makes the pink and red dots look worse.
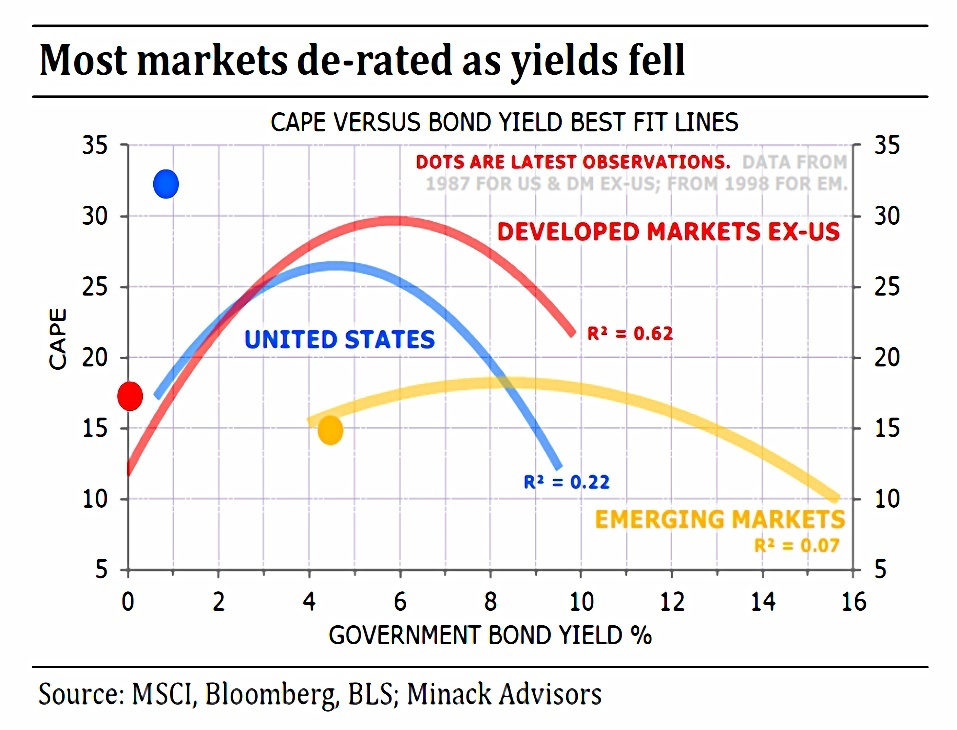
It should be noted that only the US is an outlier at present – the developed and emerging markets are each much closer to their historic curves.
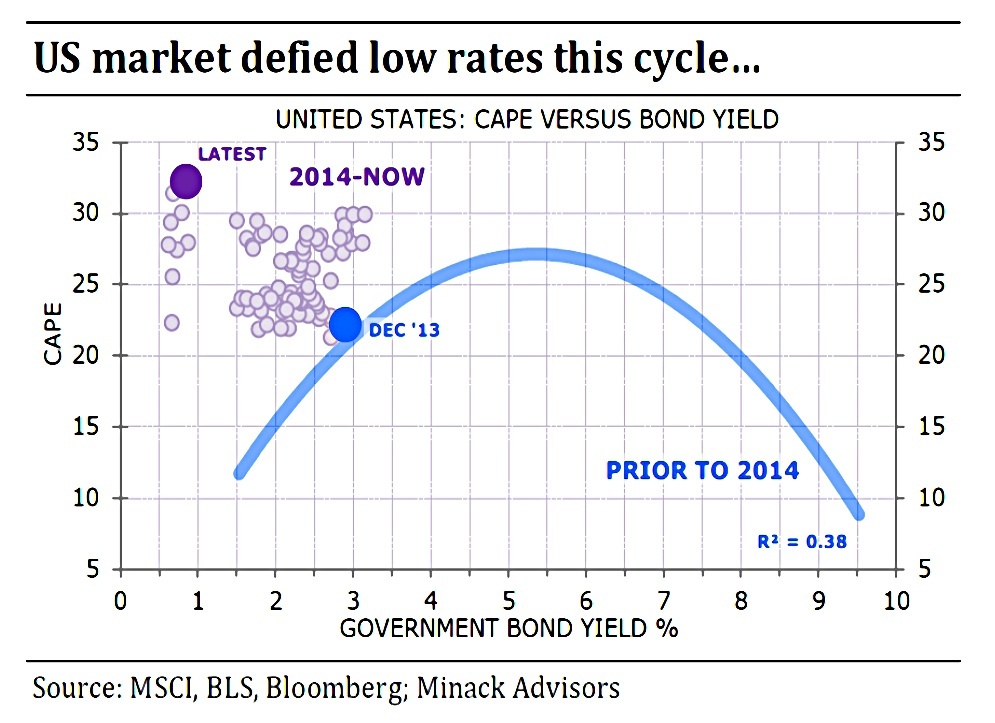
The situation in the US started to become extreme in 2014.
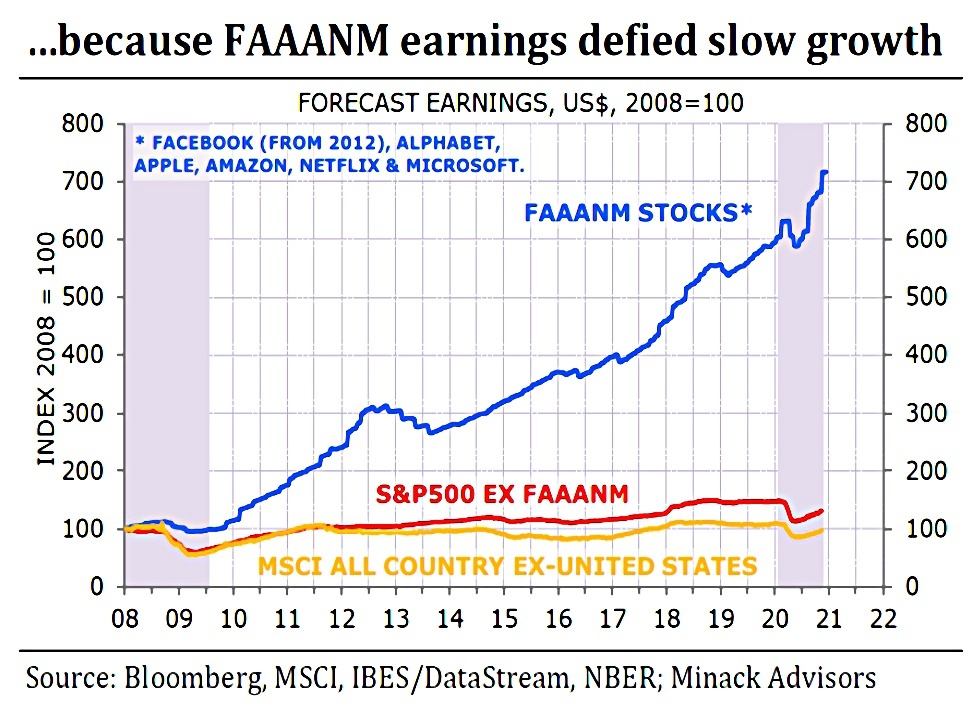
Which is when the FAAANM (Facebook, Amazon, Apple, Alphabet, Netflix, Microsoft) earning started to take off.
And now earnings estimates are rising [more generally] as expectations of a post-vaccine boom take hold. That leads stocks to trade at a higher multiple. It is earnings
expectations, not rates, that have brought the market up in the last month and it would be an earnings disappointment (presumably sparked by some disappointment with distribution of the vaccine) that would bring it down again.
Minack concludes:
It’s a terrific combination for equities if growth does improve as expected next year and rates stay low. That combination would be more beneficial for derated non-US markets than the re-rated US market.
Track records

Joachim Klement followed up on claims in his book that pension funds switch asset managers at exactly the wrong time.
They pick asset managers with a great track record over the last one to three years and fire the ones with a poor track record. Yet, in the three years after switching the asset managers the hired managers underperform while the fired managers outperform.

![]() A new paper extends the earlier research to global pension funds with $1.6 trn of assets.
A new paper extends the earlier research to global pension funds with $1.6 trn of assets.
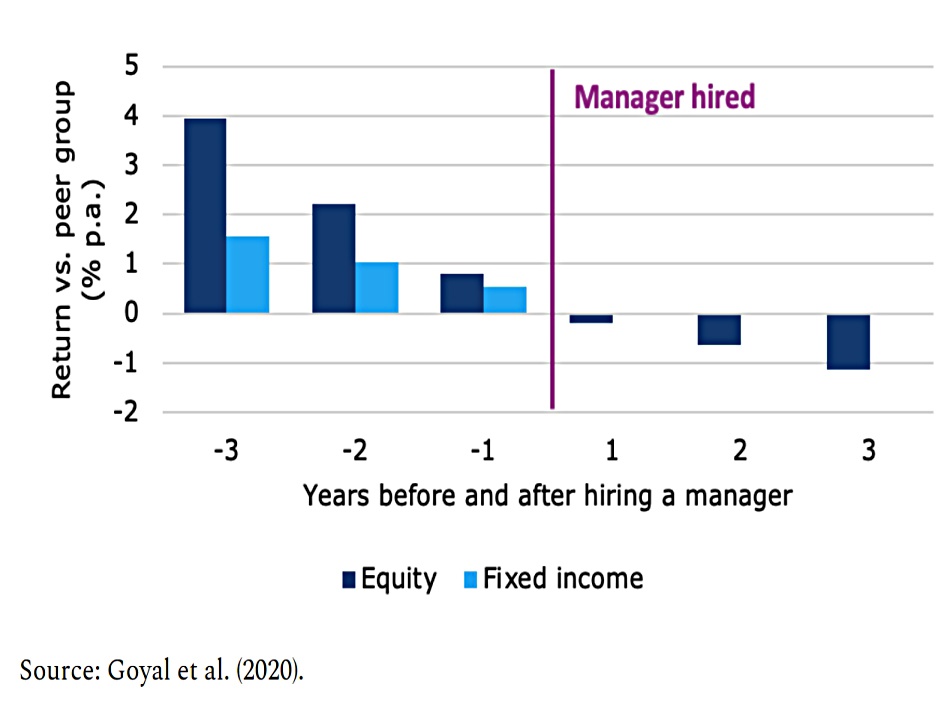
The underperformance applies to both equities and fixed income. (( A problem with Joachim’s chart means the post-hire fixed income data isn’t showing here).
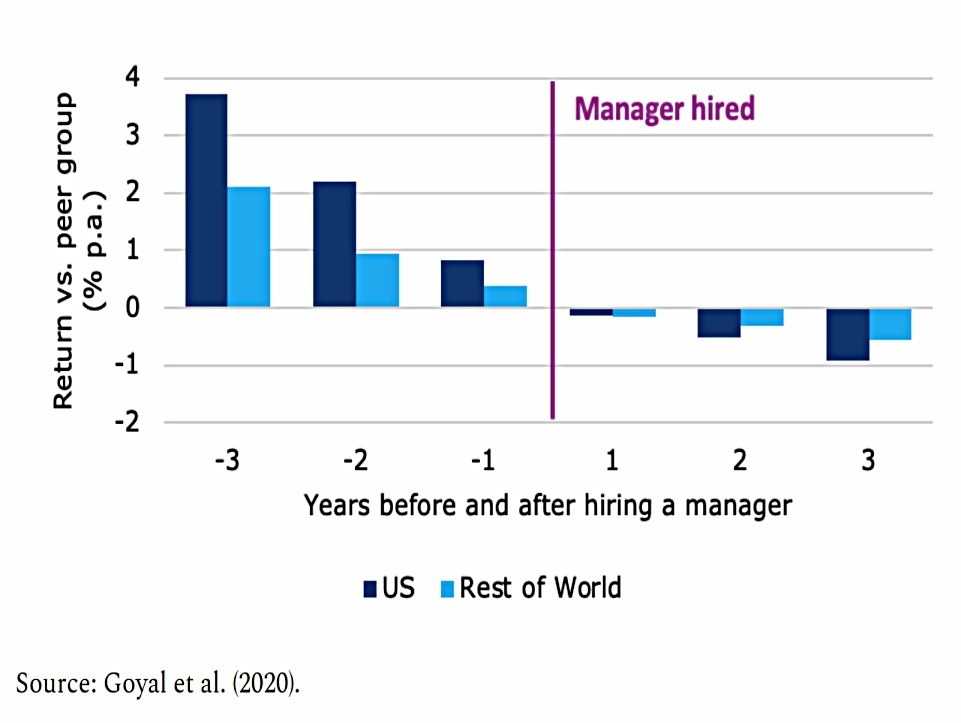
The effect is biggest in the US, but also shows up in the rest of the world.

And it shows up even in larger plans (> $100M), though it is larger in smaller schemes.
Goyal and his colleagues can identify only two significant drivers of the hiring decision. One is the performance of the asset manager over the previous one to three years and the other – if the plan sponsor or the consultant has a personal relationship with the asset manager.
Redwood fund

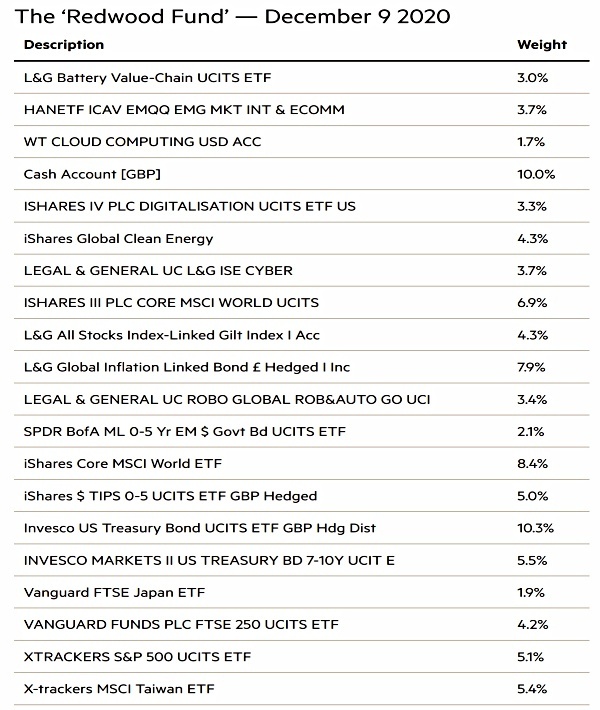
In his regular review of the ETF portfolio he runs for the FT, John Redwood said that green and tech stocks are still a good bet since investors will keep buying them as long as rates are low – even if the stocks look expensive.
John has made some changes to the portfolio since the vaccine was announced:
I quickly changed the emphasis in the fund, switching out of the US and the Nasdaq technology index which had done so well into a general world index to capture some of the gains in the left-behinds. The fund is up more than 10 per cent this year.
I’m up 8.9% as I write, so John’s performance looks pretty good to me.
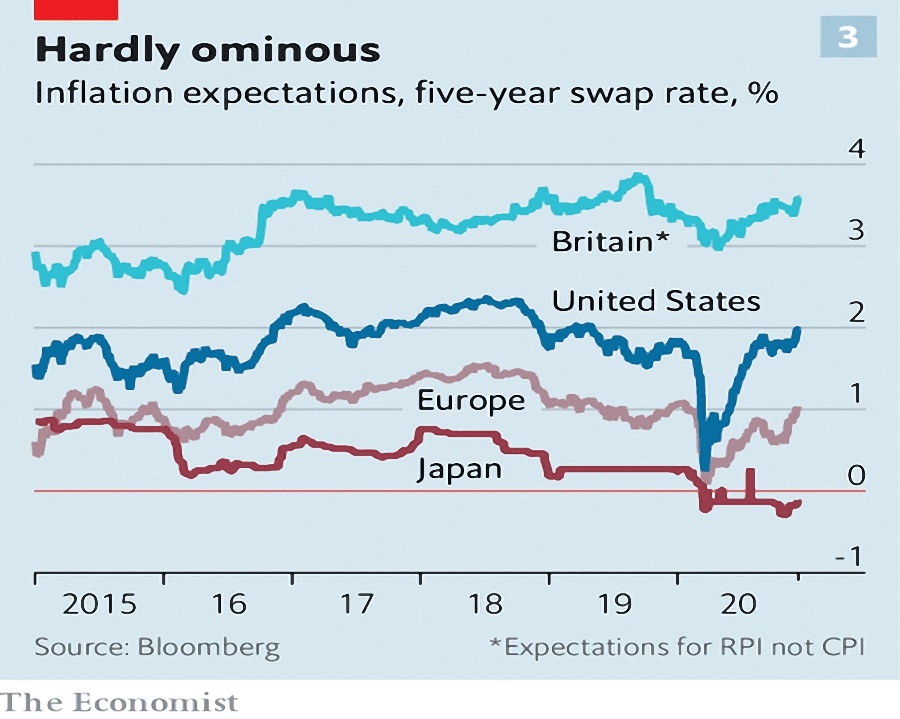
Like me and many others, John expects inflation to pick up eventually as a consequence of the money printing which has taken place this year.
- But the Japanese example shows that the mechanism may take a while.
However, while the US and the UK can copy Tokyo for a while, they cannot do so
for as many years as Japan. Tokyo mostly runs a balance of payments surplus, so it
does not need to borrow or sell prime assets to buy imports in foreign currencies.Japan also has an ageing population with a savings habit, making it easier for the
Japanese government to sell its debt to Japanese buyers. So its huge debt is almost
entirely a domestic charge, not exposed to the vagaries of international foreign exchange markets.
For now, central banks need to keep the stimulus coming until the recovery is obvious.
Inflation

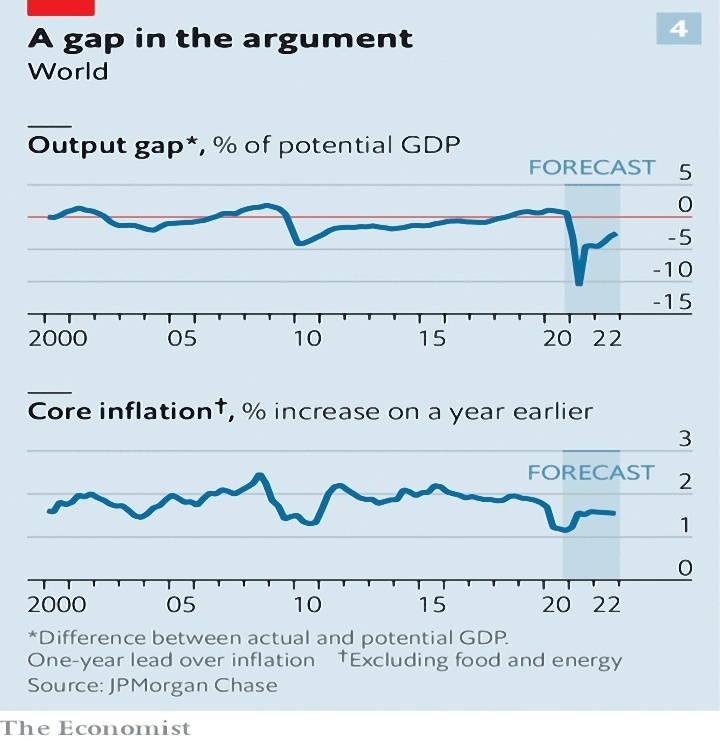
The Economist also worried that although the evidence from QE so far is that the short-term link between the money supply and inflation has broken down, inflation might return.
Even a small probability of having to deal with a surge in inflation is worrying, because the stock of debt is so large and central-bank balance-sheets are swollen.
One possibility is a burst of inflation from pent-up demand:
Once they are vaccinated and liberated from the tyranny of Zoom, exuberant consumers may go on a spending spree that outpaces the ability of firms to restore and expand their capacity, causing prices to rise.
The second option is that “structural disinflationary forces” will go into reverse:
Many societies are ageing, creating shortages of workers. For years globalisation lowered inflation by creating a more efficient market for goods and labour. Now globalisation is in retreat.
The danger here is that interest rate rises would be needed to prevent runaway inflation.
Markets would tumble and indebted firms would falter. The full cost of the state’s vastly expanded balance-sheet would become alarmingly apparent.
Central banks have failed to “lock-in” today’s low rates – issuing mostly short-term debt.
- The average maturity of US Treasuries has fallen from 70 months to 63.
Retail investors
Interactive Investor sent out a press release noting that the 350K investors on their platform have significantly outperformed the UK market to end November.
- This is good news, but since the FTSE All-Share was down by 13.2% YTD at that stage, its a low bar to beat.
With the UK market one of the worst-performing in 2020, almost any allocation away from it would lead to outperformance.
- The average (median) ii investor was down 1%, which is not great.
SIPPs were up 3.8%, ISAs down 0.4% and taxable accounts down 6.9%.
- Women slightly underperformed (-1.3% vs -1.1%).
Younger investors (18-24) did best, up 4.5%, and over-65s did worst, at -4.2%.
- I would speculate that this is down to a higher allocation to US tech stocks, though ii suggested that higher allocation to ITs was responsible – perhaps this is effectively the same thing.
Active investors – those trading more than twice per month – also performed better, at +1.8%.
Meanwhile, the Economist noted that retail investors often learn the wrong lessons from success.
- Specifically, Indian investors who were randomly allocated shares in successful IPOs confuse luck with skill.
In India, 35% of shares in IPOs are set aside for small shareholders.
Where there is lots of interest from retail investors, there may not be enough small lots to go round. In such cases shares are allocated randomly by lottery.
The winners (called the treatment group) act differently from the losers (the control group):
The treatment group are more active in trading shares other than the allocated stock in the period after an ipo that enjoys a first-day “pop” in its price. Trading volume is 7.4 percentage points higher after two months than for the control group.
The authors of the paper conclude:
Retail investors “misinterpret random gains and losses as signals about their own ability”. They misconstrue noise as information. They mistake luck for skill.
Over-trading, over-confidence and attribution errors are well known in retail investors, but here the losers (those allocated stocks that went down on day one) develop under-confidence.
- They trade less than the control group – they took bad luck as evidence of an absence of skill.
Quick Links
I have six for you this week, the first five from The Economist.
- The newspaper looked at Disney’s and Warner’s small-screen bets
- And at Ryanair
- And at the clamp-down on big tech
- And at big oil’s diverging bets on the future of energy
- And at a possible wave of supply-chain reshoring.
- And Alpha Architect tried to get to the bottom of whether size is a useful factor.
Until next time.
Mike Rawson
Mike is the owner of 7 Circles, and a private investor living in London. He has been managing his own money for 40 years, with some success.