Weekly Roundup, 30th May 2022

We begin today’s Weekly Roundup with a look at quality stocks.
Contents
Quality
It’s a quiet week for financial news, which gives us a chance to catch up with Joachim Klement.

Joachim looked at what the best definition of Quality in a stock. We have four main options:
- Profitability (return on equity/assets/invested capital, etc.)
- Simple and reliable earnings, with no accounting gimmicks
- Low financial leverage (safety) and
- High investment in future growth (usually relative to sales)
Amundi asset management sorted stocks into quintiles across each of these measures and then looked at returns from 2007 to 2020.
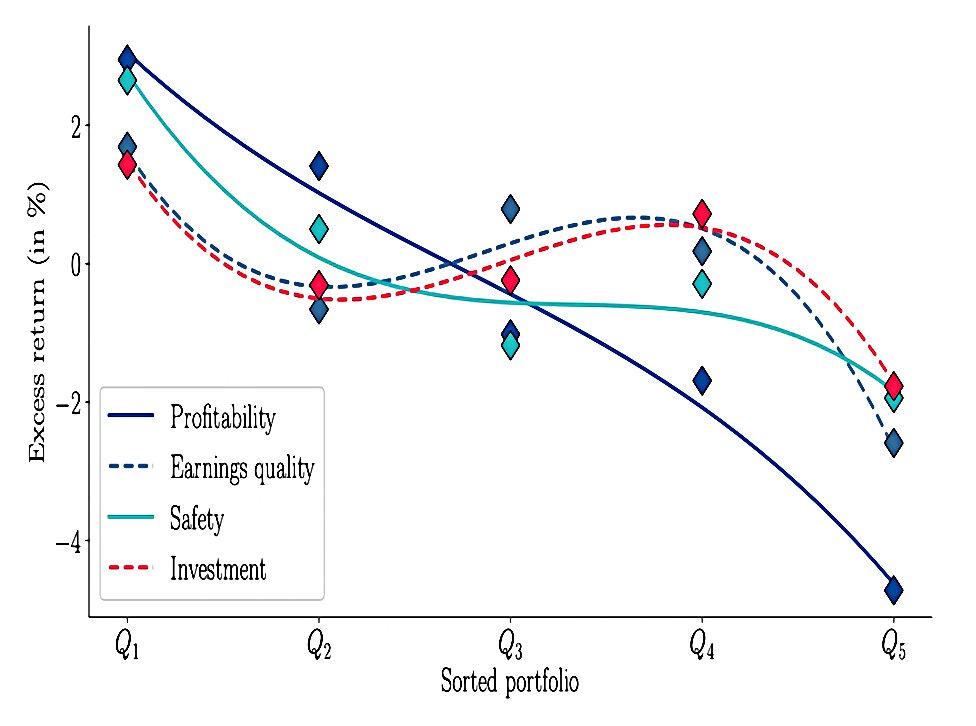
Profitability is the best measure in the sense that is best able to differentiate between high and low-quality stocks in such a way that high-quality stocks outperform.
But this data is from (during and) after the 2008 financial crisis.
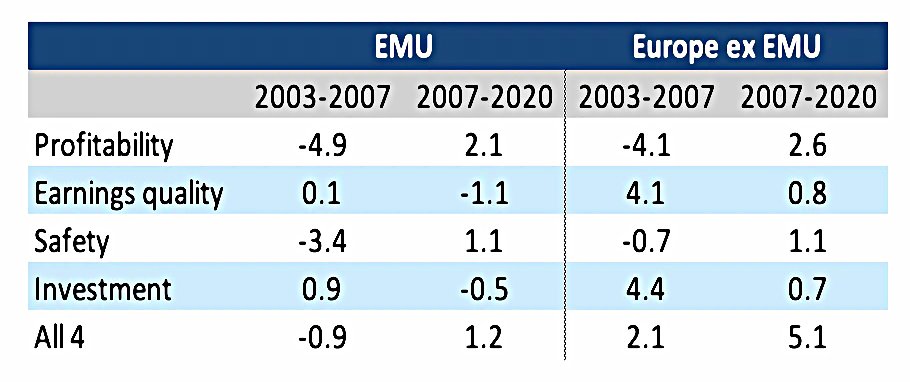
This table compares the pre- and post-GFC periods.
The performance of each individual metric was vastly different before the GFC than after. Earnings quality, for example, did really well before the financial crisis and has an abysmal track record since. Profitability, meanwhile, was doing great over the last 15 years or so but has not worked at all in the years before the financial crisis.
Using all four measures seems to be a better approach for the long term.
Loss aversion
In a second article, Joachim looked at how loss aversion changes with age.
- A recent study from City University used coin flips to investigate.
Heads, they lose $500, tails they win a certain amount. The amount at which individuals were willing to accept the coin toss determined the loss aversion.
Usually, people need odds of between 2 and 3 to get involved.
- The average for the 4,000 people in this study was 2.4
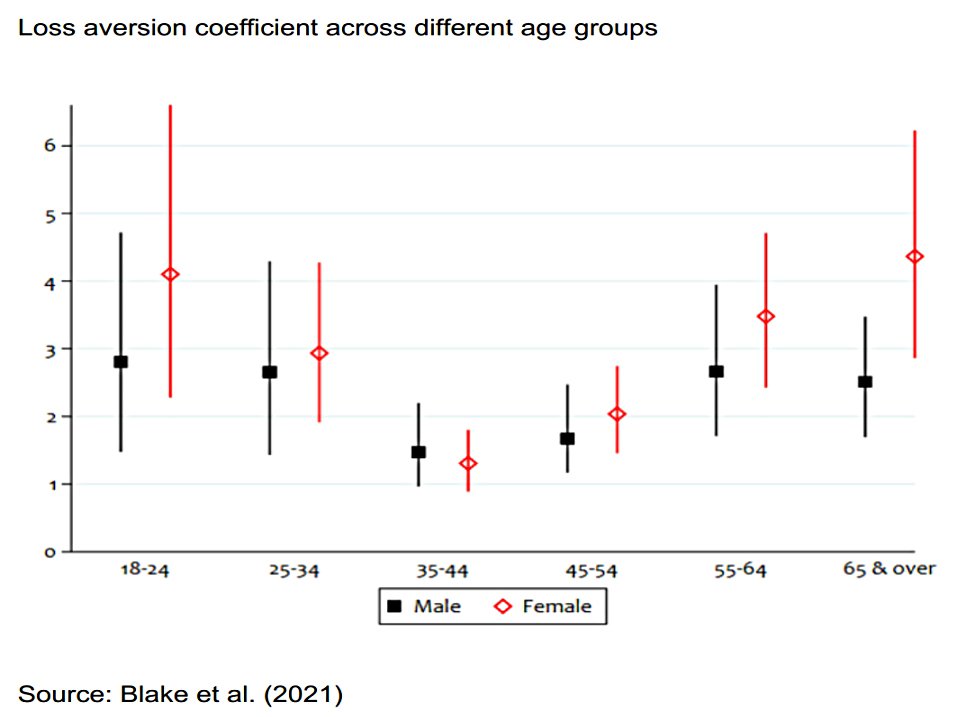
But loss aversion varied by age.
Younger people aged 18 to 24 exhibit a loss aversion coefficient somewhere between 3 and 4 as do people aged 65 and over. But people in the midst of their working lives (aged 35 to 54) tend to have much lower loss aversion, somewhere between 1 and 2.
This means that the typical investment advice – to be aggressive when young and then ease off later – goes against human nature.
The natural inclination of younger investors is to invest more defensively, mostly because they have lower incomes and fewer savings and even small losses can have a significant impact on their financial safety. Meanwhile, as we grow older and accumulate more assets, we tend to become more risk-seeking and more willing to accept losses.
Then as we hit retirement and lose our income (having used up all our human capital) we become loss averse once more.
Insiders
A third article looked at whether insiders get better at insider trades.
- Hibbert at al (2022) founds that between 2003 and 2020, open market insider buys outperformed by 2% in the following three months (8.2% annualised) and by 4.4% in the following year.
- Selling led to 0.5% gains over three months (1.8% annualised) and 0.3% after a year.
What about repeat transactions?
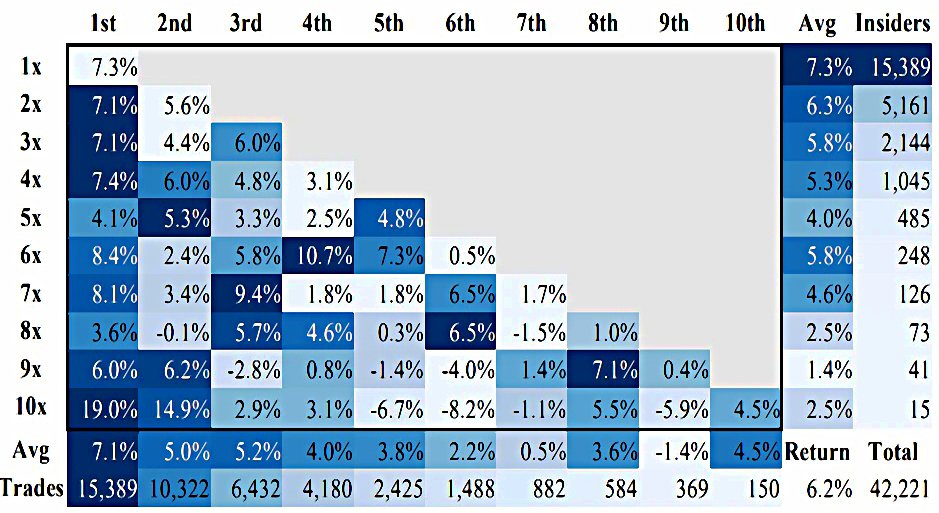
The first time an insider buys shares, the outperformance is large. But her outperformance becomes smaller the more often an insider buys shares.
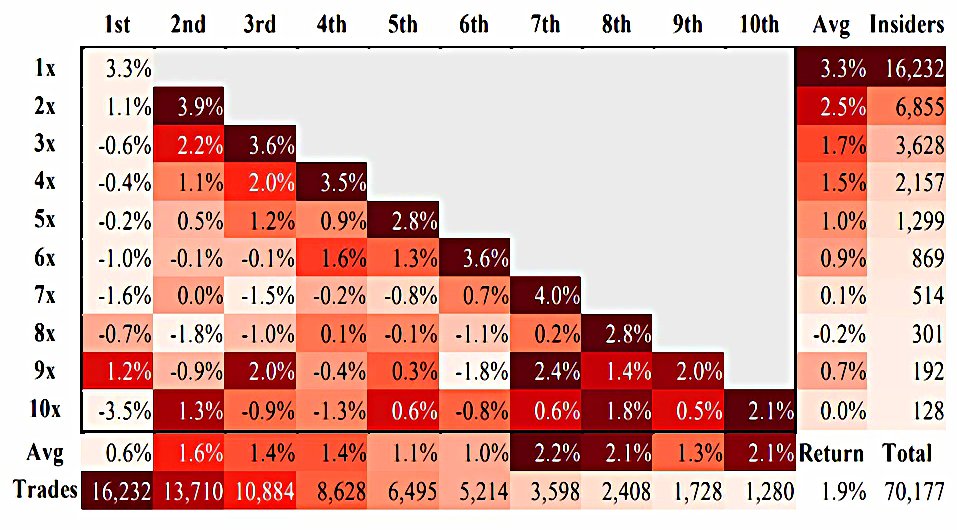
The more often insiders sell shares in the open market, the better they seem to get at timing underperformance.
This is a surprising result that is not easy to explain, but that doesn’t mean that it isn’t useful:
It is quite hard to check how many times an insider has bought or sold stocks in the company before. But if a long-serving director starts to sell her stocks, investors should pay attention. These guys often have sold shares several times before and they seem to get better at spotting trouble ahead.
Forecasting
A fourth article looked at forecasting and in particular a paper by Yang Bai.
Yang Bai’s study showed thatwhen equity risk premia are extremely high, and the economy starts to recover (e.g. after a recession or the pandemic shock of 2021) most forecasting models do work quite well.
Similarly, if the equity risk premium is very low and economic growth starts to slow down (i.e. at the end of a boom) these forecasting models again work quite well.
So the time to look at models is when valuations are at extremes, and the economy may be about to make a U-turn.
- Joachim’s own book suggests that when forecasting a complex system (like the global economy) the best plan is to run a lot of indicators and ignore most of them most of the time.
You need to look for the indicator that is stretched to the most extreme levels.
For example, throughout 2021, the P/E-ratio of the S&P 500 was hovering around 24.5x trailing earnings. Expensive, compared to the 40-year average of 19x and the most expensive valuation since 2001, but did these extreme valuations stop the US market from rallying? Of course not.
Right now, inflation is the extreme reading, and the market cannot ignore it.
The second point from Yang Bai’s paper is how models transfer from one economy to another.
- Specifically, models from UK data work well in the US, but models from US data don’t work well in the UK.
I think one reason for this is that the UK market simply had more extreme events in the past. The United States were relatively unscathed by the two World Wars or experienced extreme hyperinflation or a sovereign default in the last 150 years.
Another paper -“Global stock markets in the twentieth century” by Philippe Jorion and William Goetzmann – shows that from 1921 to 1996 the real return of most equity markets is not statistically significantly different from zero.
- The exceptions – the United States, Germany and Japan since WW2, Sweden, Switzerland, and the UK – are all markets that didn’t experience really extreme events.
The lesson is to use “hostile” data to build a model.
If you calibrate a model on benign historical data, you are running the risk of overfitting a model that will eventually just produce noise and unreliable forecasts, particularly if the underlying driver of returns change.
Joachim uses as an example the US mortgage default models from 2008 which assumed that house prices never fall all across the US at the same time.
Intangible assets and rate hikes
Joachim’s fifth article looked at the effect of rate hikes on intangible assets.
- He used research from the IMF on how company share prices react to interest rate announcements.
Intangibles have increased as a proportion of total assets in recent decades, in both the US and the UK:

This makes a difference:
In reaction to rate hikes by the Fed, companies with a high intangible asset ratio reduced their investments less than firms with a lower intangible asset ratio.
High intangibles firms have two advantages:
- They use less debt in M&A activity and so they are less sensitive to interest rates
- Intangibles are depreciated more quickly than tangible assets, so when discount rates rise, the NPV of companies with lots of intangibles falls less.
In terms of bonds, intangible assets have a shorter duration than tangible assets.
Since their equity falls less than companies with more tangible assets, its relative usefulness in MA& increases.
- The two effects reinforce one another and lead to outperformance.
If a company keeps its investment activity relatively unchanged in response to rate hikes it means it is investing more in future growth than its peers and will on average outperform them in the long run.
Cost of living
Chancellor Rishi Sunak announced a package to help with the cost-of-living squeeze, and in particular, with energy prices.
- Everyone will get a grant of £400 towards their bill, but by October my annual energy costs will have increased by around £5,000 – so that won’t have much impact on me.
The rest of the £15bn package goes to people on benefits of various flavours.
Even worse, a third of this will come from a windfall tax on oil and gas company profits.
- Retrospective asymmetrical taxes are a bad idea, and I worry that this will disincentives investment in the North Sea just when we need it most.
This is rapidly becoming a Tory government that I wouldn’t want to do business with.
Premium Bonds
The nominal interest rate on Premium Bonds (which determines the size of the monthly prize pot) has been increased from 1% to 1.4%
- That’s a chunky increase and brings premium bonds close to the best instant access rate (1.5% pa, from Chase).
The PB rate is also tax-free, so for most people, it’s effectively higher than Chase’s.
- And your savings are underwritten by the Government, the same as in a bank account. (( For the first £85K per institution, at least ))
The bad news is that you can only have £50K in premium bonds.
- And the even worse news is that with inflation at 9% pa last month, even 1.4% is losing you a lot of money on your cash.
Quick Links
I have eight for you this week, the first four from The Economist:
- The Economist reported that the wonder material graphene may have found its killer app
- And that foreign investors are fleeing China
- And explained how Xi Jinping is damaging China’s economy
- And why investors are increasingly worried about a recession in America.
- Alpha Architect looked at strategies to mitigate tail risk
- UK Dividend Stocks looked at how inflation affects dividend stocks (and what you can do about it)
- Musings on Markets look at the disparate effects of inflation on company values
- And Kalzumeus looked at Tether’s need for recapitalisation this month.
Until next time.
Mike Rawson
Mike is the owner of 7 Circles, and a private investor living in London. He has been managing his own money for 40 years, with some success.


£5k is a big hit!
OOI, did you allow for your household wealth, see e.g. https://ifs.org.uk/publications/16058.
I did not check out how precisely the IFS came up with these numbers (there is a link provided), but a big clue is probably given by the recent BoE statement that “Goods and energy price inflation together accounted for around 80% of the overshoot of CPI inflation in March relative to the MPC’s 2% target.”
Not sure I understand your comment. I just used the increase to date (my bill has tripled since August) and then added the projected percentage increase in the cap in October (40%?). Not sure how my wealth affects the actual cash I am paying.
Sorry, but does the 5k increase just apply to your annual fuel costs?
Yes. I’ve edited the text to make that clearer.
My bad – I had assumed it was overall annual increase due to soaring inflation.
You must live in a pretty huge place and/or have been on a very good deal previously.
End terrace. Victorian, so hard to insulate well. I didn’t think the deal was particularly good until it ended.
Your rise seems to be more than three times that of a typical user according to Martin Lewis – see: https://forums.moneysavingexpert.com/discussion/6360860/mse-news-households-to-get-400-boost-to-help-with-rising-energy-bills
Yikes!
A couple of other folks have written about their rises: TA over at Monevator mentions his bills doubling (in his latest post) and getting minted (in his latest post) says his have already doubled since last April, but could be triple by October. I cannot add anything useful re our own bills – as I managed to get us on a two year fix – but we are a large energy user so I suspect we would be at the top end too.
FYI:
https://uk.yahoo.com/news/homeowner-disputes-terrifying-40-000-192644391.html