Weekly Roundup, 26th January 2015

We begin our Weekly Roundup as usual in the FT, with Jonathan Eley.
Contents
Don’t buy IPOs
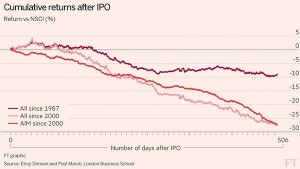
This week’s “chart that tells a story” really does what it says on the tin: it screams “Don’t buy IPOs”.
A report from LBS measures returns from new issues against the Numis Smaller Companies Index (the bottom 10% of the main market). For two years after IPO, the average underperformance since 2000 has been 27%. Aim shares did worst, with main listings only under-performing by 16%. Stagging (selling after a first-day gain) can still make money however.
Extending the data back to 1987 reduced the underperformance down to 9%, which the professors put down to privatisations of mature public businesses at attractive prices – this is probably where most people picked up the bad habit of subscribing to new issues.
This is probably not a massive shock to most people – insiders are unlikely to sell to outsiders unless the conditions are in their favour – but it’s nice to have the real-world data. You may get lucky with an IPO (Just Eat and Poundland are recent issues that are still above their float prices) but you are swimming upstream.
GDP vs happiness
In the FT Magazine, Tim Harford wrote about the tendency of politicians to aspire to replacing GDP as a measure of economic success whenever it doesn’t flatter them. Cameron has advocated well-being or happiness (to soften his image), Milliband wants to track “cost-of living” (to deflect from Tory success in increasing GDP).
Tim’s response is that no single number (not just GDP) can ever be sufficient. As an example, median wages for those in full-time employment rose by just 0.1% last year, well below inflation. Or was the rise 4.1%?
The first number includes those starting a new job within the year, the latter only those in the same job for 12 months. If high-earners retire, and low-income workers (immigrants, school-leavers) join the workforce, the numbers will be different.
Which number is correct? Or rather, which is more useful? And that depends on what question you are trying to answer. We need to measure everything, not pretend that we are measuring the wrong thing.
Dodging the mansion tax
Back in the paper, there was a report on plans by the wealthy to avoid the mansion tax by dividing their properties or otherwise minimising their value. Separate leases, and perhaps ownership by separate family members might be necessary. This would of course increase council tax instead.
Setting up B&Bs, business centres or conference rooms were also being discussed, and any home improvements might be deferred. Owners were also likely to shop around for low property valuations. The report also predicted that owners would take councils / the government to court over the bills.
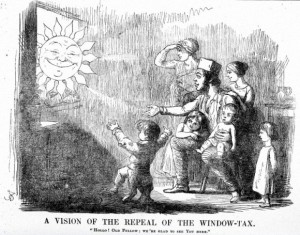
There are parallels with the window tax of 1696, charged on properties with more than 10 windows. This led to the expression “daylight robbery” and the bricking up of many windows. Nonetheless, the tax remained in force for 156 years. It was only repealed in 1851, after the introduction of a permanent tax on income.
Inequality
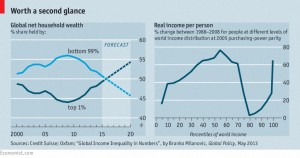
Oxfam published a forecast that the world’s wealthiest 1% will soon have a greater net worth than the remaining 99%. The Economist made two points against this:
- be careful when projecting trends – Oxfam uses the trend from 2010-14 to project the crossover in 2016; using date from 2000-14 would put the crossover in 2035
- net wealth as a measure produces some odd results: by neglecting human capital, US college students appear to be amongst the poorest on earth, as do their parents with negative equity from the recent house price crash
Like the newspaper, I prefer to use income as a measure, and this shows that inequality is in fact decreasing. In rich countries it is going up, as the richest increase their share of the pie.
But the former poor (now middle-class) in emerging economies have done well. The big losers are the middle-class of the developed world, but Oxfam won’t be issuing a press-release about that.
Value at Risk
The Economist also examined the impact of the 20-standard-deviations move in the exchange rate which followed last week’s removal of the Swiss Franc’s peg to the Euro.
The “value-at-risk” models used by banks to calculate their maximum expected losses are based on historical volatility. Since the peg had produced artificially low daily movements over the past three years, predicted losses were very small and several banks (Deutche, Citi and Barclays) are reportedly embarrassed.
It’s a bit like looking at how much a fault line has moved over the past few years in order to predict the size of the next earthquake. Unless you have 100 years of data, you’re probably going to end up with an under-estimate. Once again, the big picture and the long-term are where it’s at.
Negative bond yields
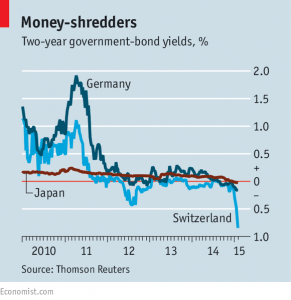
The paper also looked at why investors would choose to lose money for certain by investing in the government bonds from ten countries which now show negative yields.
For large investors, holding physical cash is impractical, and short-term bonds and bills are a necessity (there are also regulations which require government bonds to be held by some institutions). Uncertainty over Greece might make negative 2-yr German bonds attractive. But what about 10-yr Swiss bonds?
The implication is that investors expect either negative short-term rates for the next 10 years, or deflation (ie. positive real returns while nominal returns are negative). A third explanation is that investors predict currency gains (though that ship may have sailed for the Swiss bonds).
But perhaps just as likely an explanation as deflation is that investors were predicting the QE just announced by the ECB. This bond-buying should drive prices up (and yields even lower) so that they can be offloaded at a profit before government efforts to bring back inflation lead to losses.
ECB QE
The ECB finally announced its QE programme, which weighed in at just over €1 trillion spread across 18 months. This was at the high end of expectations (set by judicious leaks from the ECB itself) but did come with the promise to continue as long as needed to get inflation back up close to 2% pa.
On the BBC website, before the announcement, Robert Peston took a look at the theoretical impact:
- QE increases the price of the government bonds that are bought,
- reducing their yield and hence the interest rate (borrowing cost) paid by the government,
- and hence in theory the rate paid by everyone else.
- In an ideal world, the cash paid by the government to the previous holders (banks and investors) is either loaned out or reinvested, increasing private sector credit.
After the announcement, The Guardian asked a dozen experts what they thought. The consensus was not overly positive:
- Andrew Sentance, PCW: announced QE is only 7% of GDP, cf. 20% by BoE in 2009, and it’s also very late – how much lower can bond yields be pushed? The weaker euro may help a bit.
- Nick Kounis, ABN Amro: QE should lift growth and inflation significantly, but structural reforms (more investment, more flexible labour markets) are needed for long-term growth.
- Gary Jenkins, LNG capital: Will it work economically? It did for the US and the UK, but not for Japan. It’s positive for bonds and stocks.
- Alasdair Cavalla, CEBR: Will it work? financial markets are much less important for Eurozone firms than in the US and UK. Property prices don’t improve consumer confidence in the same way. Europe is less export-dependent than Japan, where a falling exchange rate has not fixed things.
- Nancy Curtin, Close Brothers: QE will improve liquidity and lower the euro to boost exports. But Greece will be a big factor.
- Alastair George, Edison research: the monthly amount is bigger than the leaks, but only 20% involves risk-sharing between countries. Is that enough?
- Marc Ostwald, ADM Investor Services: loss-sharing is limited and the mechanism seems overly complicated.
- John Longworth, British Chambers of Commerce: it may be too little, too late. Will it improve credit to the private sector? Sweeping structural changes are needed, or British exporters will be impacted.
- Paras Anand, Fidelity: the plan has as many shortcomings as benefits. Does the ECB as an ever-present buyer of government debt reduce the pressure on Italy and France to implement structural reform? The low level of central risk sharing may hamper Eurozone integration.
- Denis de Jong, UFX.com: it’s the last roll of the dice for the euro. The Eurozone is a patchwork of economies and banking systems, and a lot of people will be holding their breath to see if QE works.
- Darren Hepworth, TD Direct Investing: many investors will breathe a sigh of relief, but the Greek elections will be crucial.
- Danny Vassiliades, Punter Southall: by displacing UK investors from Eurozone debt, QE may increase demand for gilts. This will increase pension liabilities and deficits in the short-term.
Greek elections
Last night Syriza won the Greek election by promising that the country will become richer by not sticking to their bailout agreement. It looks like they will fall just short of an outright majority, and so should have their more extreme views somewhat tempered by a coalition partner.
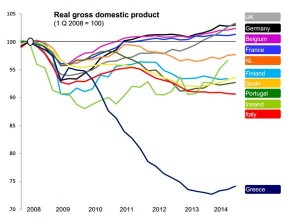
How serious this result is for markets, the Euro and Greece, we shall have to wait and see. For now, here is a chart I got from Robin Wigglesworth of the FT which explains why the Greeks have come to such desperate measures:
Until next week.








1 Response
[…] IPOs of established companies are unprofitable for initial investors, what chance do those financing […]