Irregular Roundup, 8th January 2024

We begin today’s Weekly Roundup with the UK stock market.
John #1

The first week of the new year saw the 40th anniversary of the launch of the FTSE-100 index, which was the cue for many commentators to reflect on the state of UK equity markets.
- I arrived in London in 1986, so I missed the launch of the FTSE, though I was just in time for Big Bang.
The general tone was one of disappointment.
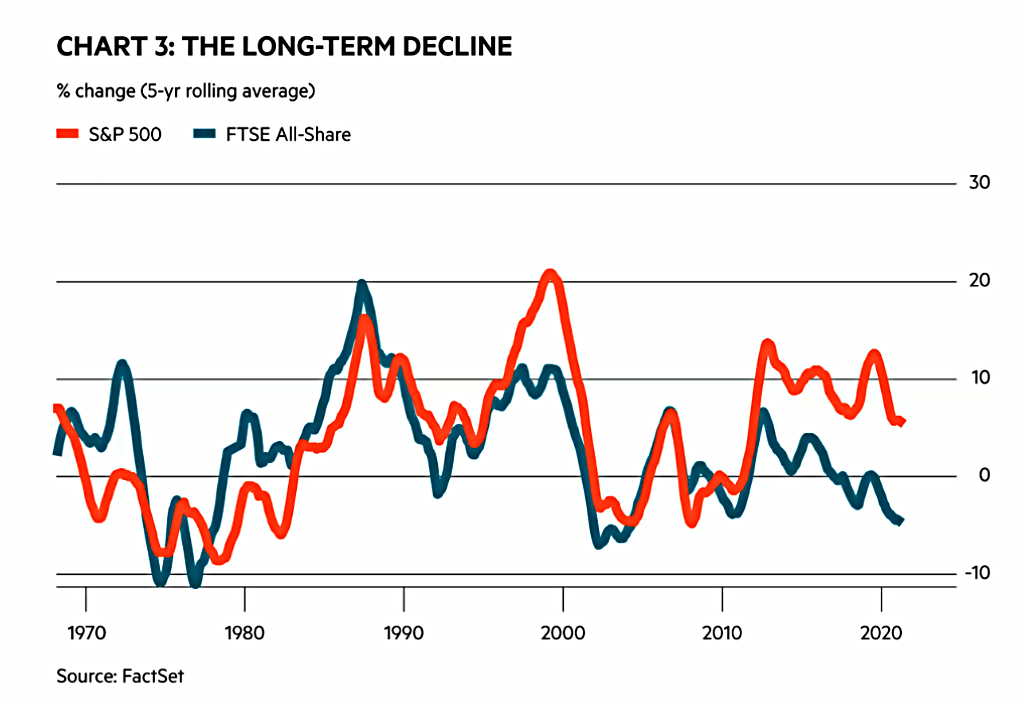
- John Authers pointed out that the performance of the FTSE doesn’t offer much cause for celebration.
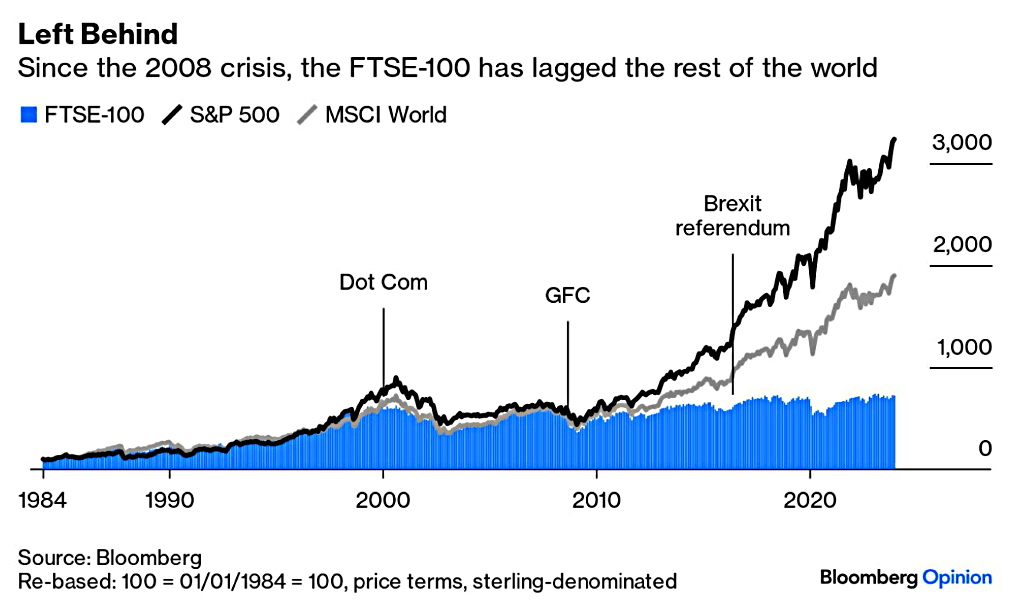
Since a few years after the 2008 GFC in particular, but also through the dot com boom of 1999, the FTSE has trailed the world market and has been trounced by the S&P 500.
- Brexit hasn’t helped and the gap has grown since 2016, but it’s really about the domination of US tech.
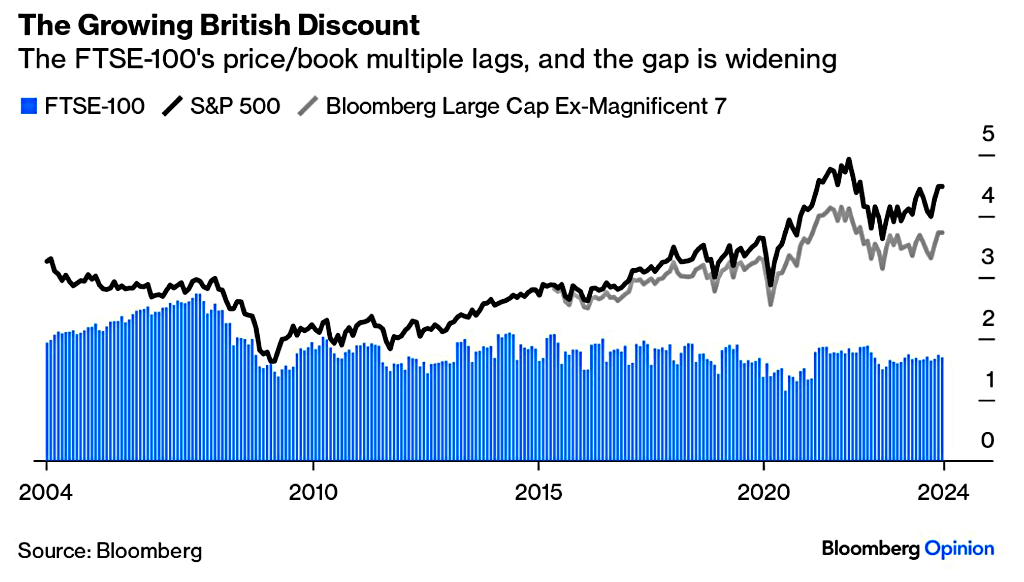
UK PEs are much now lower than the S&P 500, even when the Magnificent 7 tech stocks are excluded.
Another issue for the UK is the FTSE’s heavy weighting in international mining groups, which tend to list in London. When commodity prices are weak, as for most of the last decade, this drags on the index.
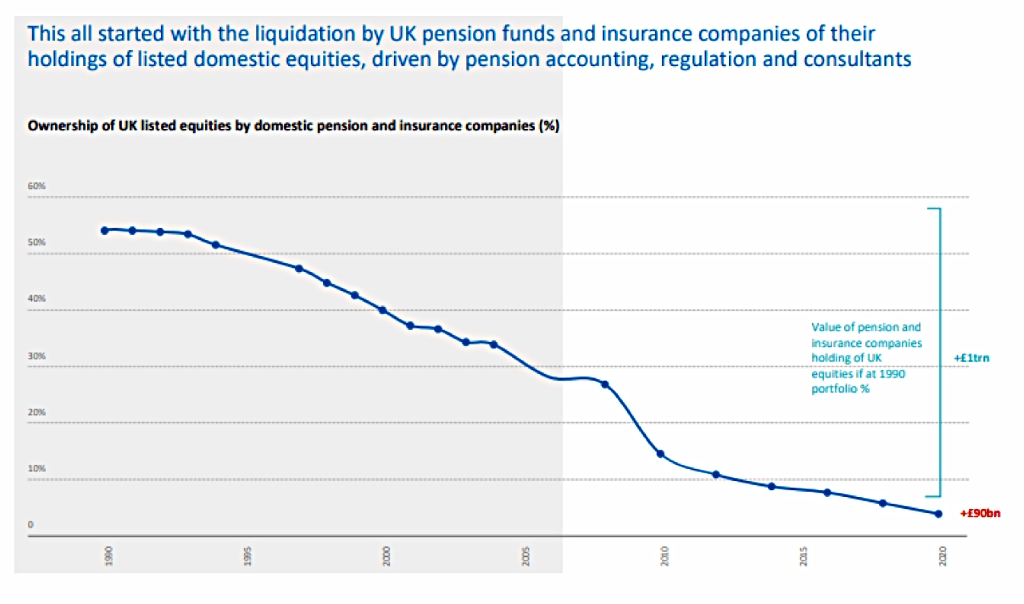
John offers up the behaviour of UK pension funds as an alternative scapegoat.
Back in the 1950s, they pioneered what would become known as the “Cult of the Equity”. Rather than stick to bonds, they piled into equities, which at the time yielded more. Over the last 20 years, that effect has moved totally into reverse. Equities now account for less than 10%, a staggering reduction over a period when stocks have generally performed well.
The reason is liability matching, encouraged by regulators.
With many defined benefit pension plans in deficit, they began to buy bonds so that they could come closer to guaranteeing an income.
(You might have expected them to aim for the maximum return portfolio, which could have included 70% in stocks.)
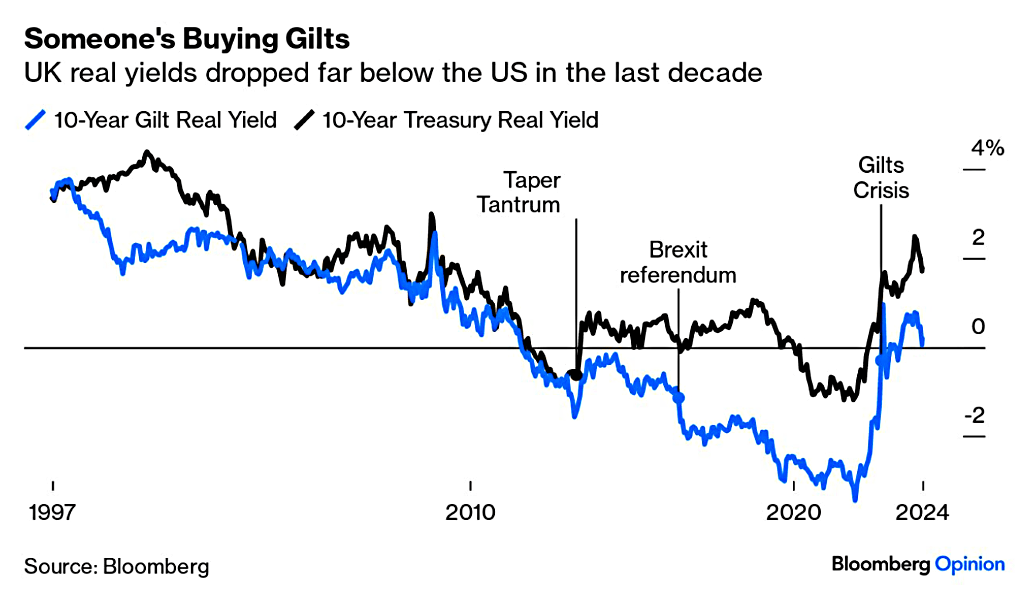
This has pushed yields down via a vicious/virtuous cycle:
Lower bond yields made it more expensive to guarantee a future income, prompting more purchases of bonds and even lower yields.
Some funds made risky derivative bets on interest rates staying low, and when they didn’t, somehow Liz Truss got the blame.
Politicians on both right and left are now making noises about forcing UK pension schemes to invest in UK companies.
- I’m normally opposed to this kind of interference in free markets, but so long as I’m free to invest my SIPPs and ISAs internationally, it wouldn’t be the end of the world.
BearBull

In the Investors’ Chronicle, Bearbull tried to explain the UK stock market in three charts.
The charts will tell us whether we should be invested in UK equities and, if so, what outcomes we might expect.
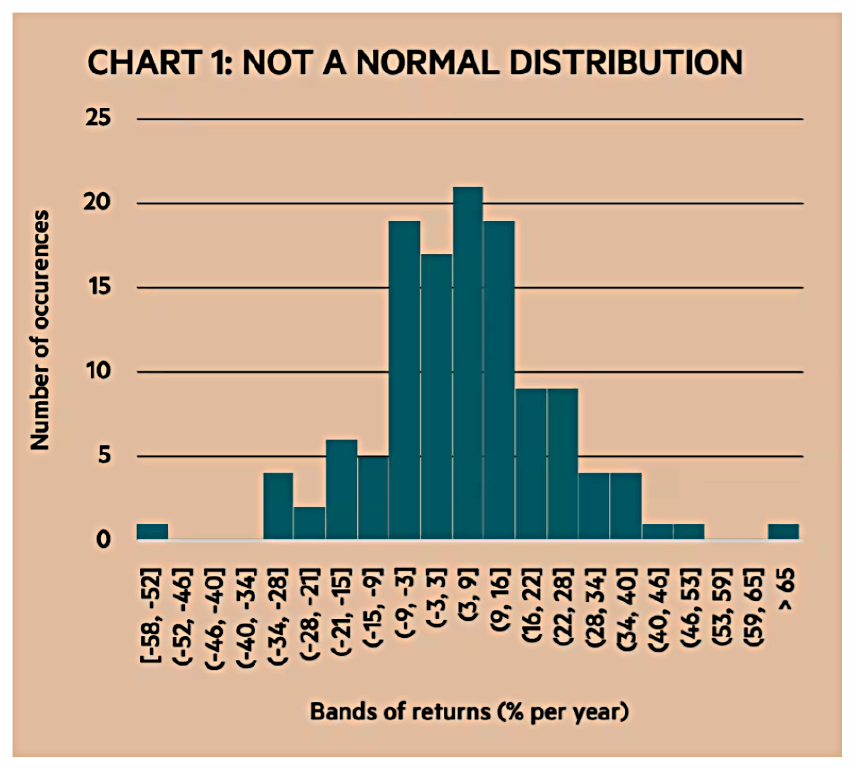
The first shows year-on-year real returns for UK stocks since 1900.
- It’s not quite a normal distribution, as it’s not symmetrical around the average.
The average return for all 123 years is 5.5 per cent so intuition tells us that the middle band, for returns between3 per cent and 9 per cent, should hold the most observations, as it does – 21.
But, rather than falling away symmetrically, the bands diminish messily. Returns for the band 3 per cent to minus 3 per cent feature less often than theory says they should; returns of minus 3 per cent to minus 9 per cent more often, and so on.
5.5% pa is pretty good, and only one year in six is below -14%.
- But there are two really extreme years, one at either end of the distribution.
There are periods when investors want to be in their market of choice and some when they don’t. Just a few periods can make a huge difference to overall investment returns.
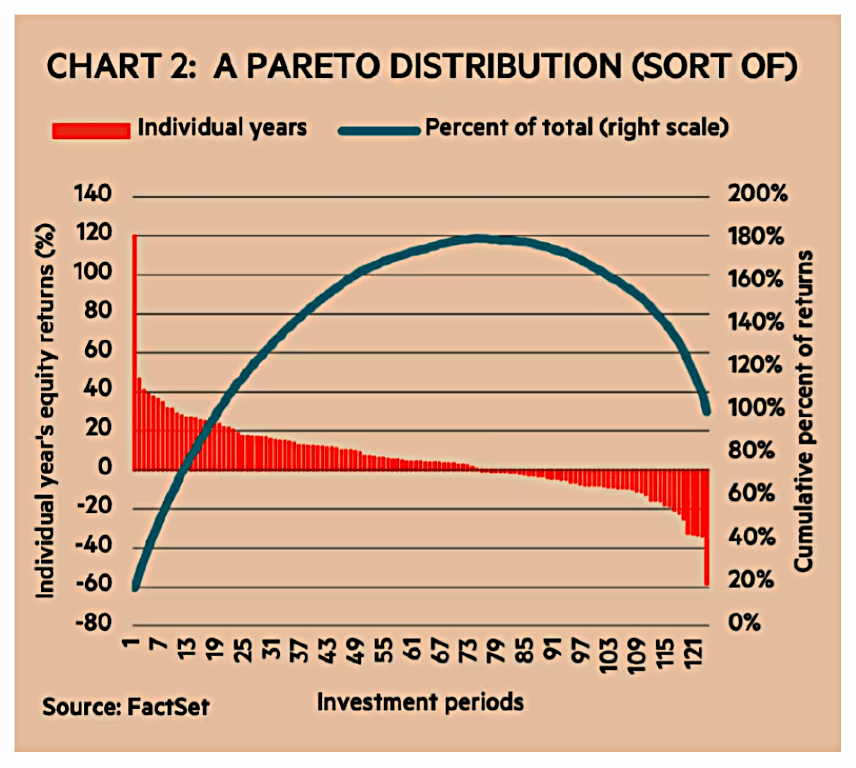
Bearbull calls it a Pareto distribution (though real Paretos stick to positive values).
For any quantifiable variable, 80 per cent of the output will come from 20 per cent of the input. 80 per cent of the profit made by Tesco comes from about 20 per cent of its outlets. 80 per cent of a nation’s wealth is owned by 20 per cent of its households.
Going back to the chart:
The vertical bars plot each year’s return. The line shows the cumulative proportion of returns, which tops out at 181 per cent in year 73 before absorbing the effect of loss-making years. 80 per cent of the net returns are made from the 13 best years.
You need to be in the market for those years (and ideally, out of it for the worst 10% to 20% of years).
But there’s the rub. It would have been tough to have had one without the other. Those two extremes were successive years. In 1974 UK shares suffered a 58 per cent drubbing only to bounce back by 120 per cent the following year.
None of the best years have been since 1990, when the UK started to lose ground against the S&P 500.
A second article asked whether UK investors could succeed by putting in the ‘extra effort’.
The investor faces two questions:
- Are excess investment returns available for taking on extra risks?
- Is it worth putting in the extra effort to stand the chance of capturing excess rewards?
Bearbull decides on inflation as the determinant of excess returns, rather than the traditional risk-free rate (the government bond yield).
- He also switches from UK stocks to the global index.
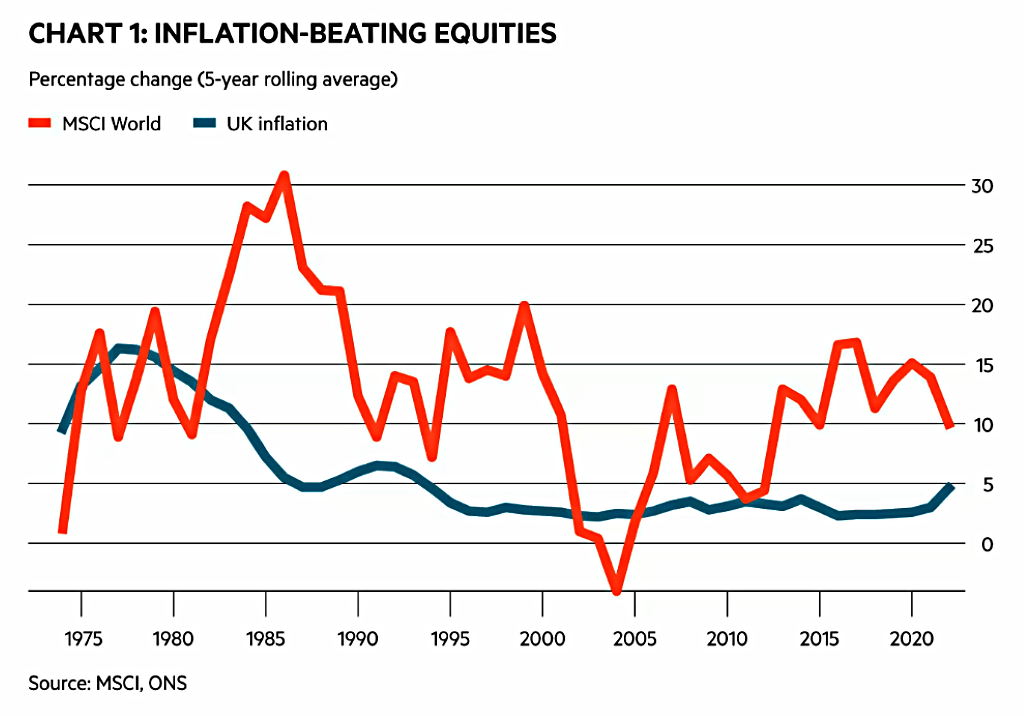
On this basis (global) equities do well.
For the 49 [five-year] periods under review, in only one does the MSCI’s return show an absolute loss, minus 4 per cent for the period 2000-04. And only on 10 occasions has the equity index’s rolling return been less than its corresponding inflation rate.
The high inflation late seventies and the early 2000s were the periods to avoid.
In the 53 years to the end of 2022, total returns from global equities grew at 10.8 per cent a year (and even UK equities managed 10.4 per cent) while UK inflation rose at 5.2 per cent.
The good results from indexing mean that extra effort is unlikely to be worthwhile.
And for investors in the UK, the economic prospects are poor.
- Bearbull cites the work of the Resolution Foundation (a lefty think tank followed by Labour) on UK productivity.
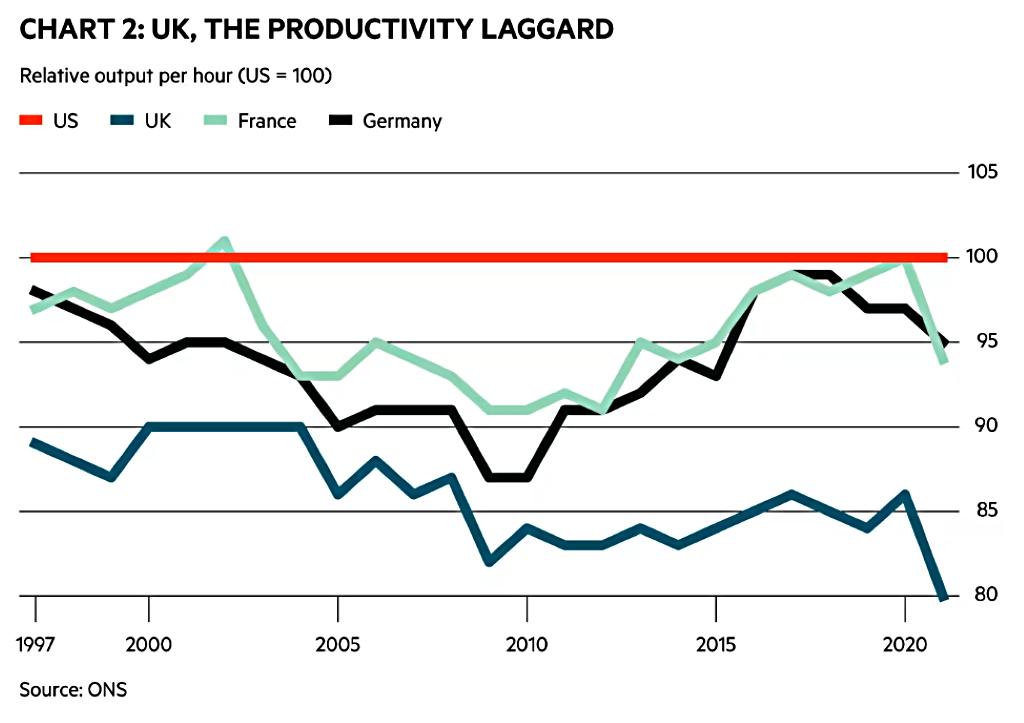
We haven’t been keeping up with Europe and the US.
There is little need to go beyond the much-quoted phrase from Paul Krugman, a Nobel Prize-winning economist, who famously remarked that “productivity isn’t everything, but in the end it’s almost everything”.
Higher productivity means higher wages and more reinvestment in future productivity gains.
When a once-wealthy nation ceases to be wealthy, it takes a long and painful process before the depressing reality sinks in; before spending – with borrowed money – gives way to saving, before deferred gratification becomes virtuous once more, before consumer spending comes second to capital spending. And the UK has all this to do with an ageing population.
And a happy new year to you also, Bearbull.
Merryn

On Bloomberg, Merryn Somerset Web argued that the 40 years of the FTSE-100 haven’t all been bad for UK investors. She describes the FTSE-100 as:
An index made up almost entirely of old-fashioned-looking assets chucking out unexpectedly large amounts of cash.
But as we saw above, it trails the US and Europe and has only just beaten Japan over 40 years.
Things are rather worse if you just look at this century. The S&P 500 has produced6.1% a year, the MSCI Europe ex-UK 2.9%, and even Japan has given it investors 0.9%. But the UK? A mere 0.4%.
If anything, the decline has accelerated over the last decade, leading me to reduce my allocation (12% at present, but likely to head south of 10% over the next 12 months).
The numbers look a little better if you re-invest dividends:
Annual returns are more or less in line with those from Europe (8.6% vs 8.7%) and much closer to the S&P 500(11.4%).
Things are even better if you measure each index in its home currency:
That puts the FTSE 100 on 8.6% a year, Europe on 7.4% andthe S&P 500 on 11%.
But we’re still behind the US and the world (which is mostly the US) since 2000.
The good news is the UK index is cheap (on most valuation measures over 30 years) and also comparatively cheap (compared to the rest of the world).
Merryn remains optimistic:
It comes with a lower level of long-term capital risk than more-expensive markets, sentiment toward markets and hence theflows into them can turn on a sixpence (look at Japan), and as long as it looks like the cash is going to keep coming, it’s worth holding.
John #2

Merryn’s Bloomberg colleague John Stepek felt that FTSE-100 returns have been disappointing.
The UK index was doing fine during its infancy, adolescence and early 20s. In the latter years of the 1980s, it lagged the rest of Europe but beat the US. In the ‘90s, it lagged the US but beat Europe and Japan. In the 2000s, it did the same. But across the 2010s and the 2020s it was the worst performing out of that peer group.
He pinpoints 2008 as the turning point.
If 2008 was a global financial bubble, it was also a UK bubble, or more specifically, aLondon bubble. The collapse in interest rates to zero also had another effect on the UK. The UK’scorporate pension deficits exploded over the period, because the value of their future(theoretical) liabilities soared.
Which led to the liability matching described by John #1 above.
The Brexit vote in 2016 was something of a cherry on the cake. That cratered sterling and sent the UK into a lengthy period of political chaos, one which gave global asset managers all the excuse they needed to put the country in the “too hard” pile.
But once again, the FTSE is now cheap and sterling is not overvalued.
- And political instability could be over if we avoid a hung parliament later this year.
With interest rates no longer at zero, liability matching should be over.
So John foresees an improvement, or failing that, a wave of takeovers, share buybacks and de-listings.
Quick Links
I have just three for you this week:
- The Economist wrote about Three surprises that could inflame commodity markets in 2024
- Alpha Architect said that Crowded Trades Increase Crash Risks
- And Bloomberg thinks that The UK’s Communist Housing Market Is Ripe for Revolution.
Until next time.
Mike Rawson
Mike is the owner of 7 Circles, and a private investor living in London. He has been managing his own money for 40 years, with some success.