Weekly Roundup, 16th June 2015

We begin today’s Weekly Roundup, as so often, with Merryn’s column in the FT.
Contents
The next mis-selling scandal

Endless PPI calls prompted Merryn to wonder where the next mis-selling scandal might come from. It needed to have three features:
- consumers feel they have no choice but to buy it
- they don’t quite understand how it works
- it might turn out to be very expensive
She decided on the new compulsory DC pension schemes that every employer in the country, no matter how small, now has to provide. Most employees have no firms views on pensions, and a default fund must be provided.
And quite often, the default fund will include lifestyling. Lifestyling funds start off in risky assets and move into less risky ones as you get closer to retirement. The idea is that you won’t lose money just when you need it. ((As an example, look at the funds offered by Nest, the government provider – those retiring in 25 years already have 30% in bonds; those retiring in 7 years own 45% bonds)).
Merryn questions the entire concept of a one-size-fits-all fund, given the many paths available under the new pension freedoms. But even if this unicorn did exist, the lifestyling fund is an archaic version of it. Apart from the fact that there is a bond bubble and a crash waiting to happen, lifestyling reflects the old regime.
If you are planning to buy an annuity on the day you retire, stabilising the value of your fund in the years approaching that date will seem sensible. If bond prices fell and your pot shrank, bond yields would rise and you would get more annuity for your money anyway.
If you plan to live off your fund for the next 30 years, having been 50% invested in bonds for years is not going to get you off to a great start. People need continued exposure to growth assets, and that means equities.
Life in the old bull yet

Ken Fisher was making the case for the continuation of the bull market. He pointed out that he had been saying the same thing since January 2013.
As Sir John Templeton famously said, bull markets die on euphoria, and there’s none of that about. Indeed, there’s plenty of worry instead: China, Greece, Brexit, QE in Europe and Japan, over valuations in stocks, a bubble in bonds.
Janet Yellen thinks stocks are overvalued, but Greenspan’s “irrational exuberance” comments came 39 months before the actual crash of 2000.
To kill the bull, we need a big and nasty surprise – Grexit is neither – or the fabled euphoria. The time to worry is when the negative headlines disappear, and the celebrity bears are ridiculed. If George Osborne declares an end to boom and bust, sell.
But Ken thinks the bull could continue for years.
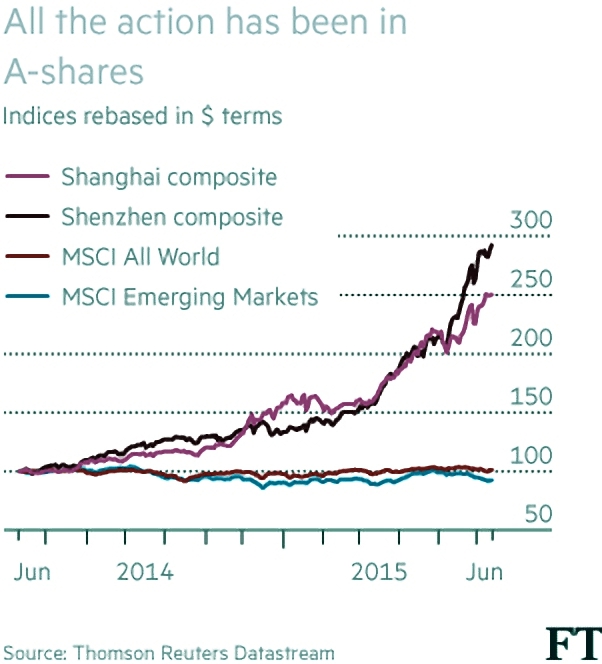
Indices and the China bubble

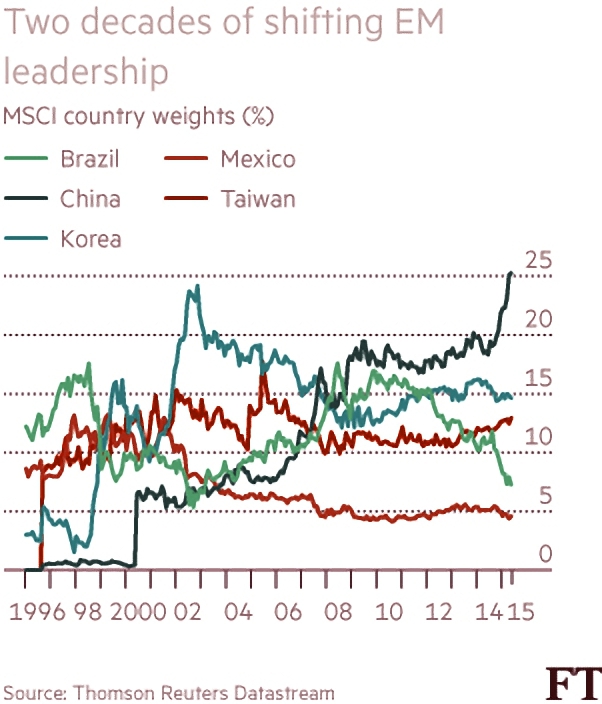
John Authers looked at the impact of potentially including Chinese A-shares in emerging market indices. This market is the world’s most heavily traded, but it is disconnected from the rest of the world. Its potential admission to the major emerging market indices is a big deal.
Indexers now drive major capital flows. MSCI’s emerging markets index is used as a benchmark for $1.7tn in assets. Even nominally active funds shift their holdings when the composition of the index changes.
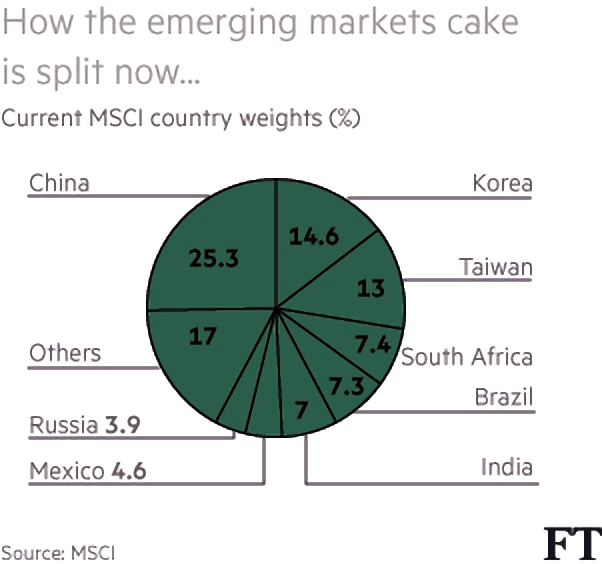
China, through Hong Kong shares, is currently 25% of the index; with the A-shares this would rise to more than 45%. No doubt “EM excluding China” indices will be available soon.

Fund managers are opposed to the change. They don’t want to be judged against a benchmark which includes stocks they can’t buy (especially stocks which have performed extraordinarily well in the recent past). There is also the worry that adding A-shares to the index could further inflate the existing bubble in the market.
In fairness, China has been trying to open up the market:
- The Hong Kong-Shanghai Connect service makes it easier to trade in the shares;
- capital gains tax rules have been clarified;
- the “QFII” quotas for foreign investors have been increased.
MSCI’s compromise is to work out further reforms with Chinese regulators with a view to the A-shares joining the index in May 2017. FTSE – the other big indexer – has created a shadow index that includes A-shares in proportion to the foreign investor quota.Vanguard plans to track this index.
When the UAE was added to the index, shares dropped by 40% in 6 months, after rising by 234% in the two years preceding admission. On this basis, John suggests investors look at Pakistan and Saudi Arabia.
Executive pay
The FT also reported on the boom in executive pay.
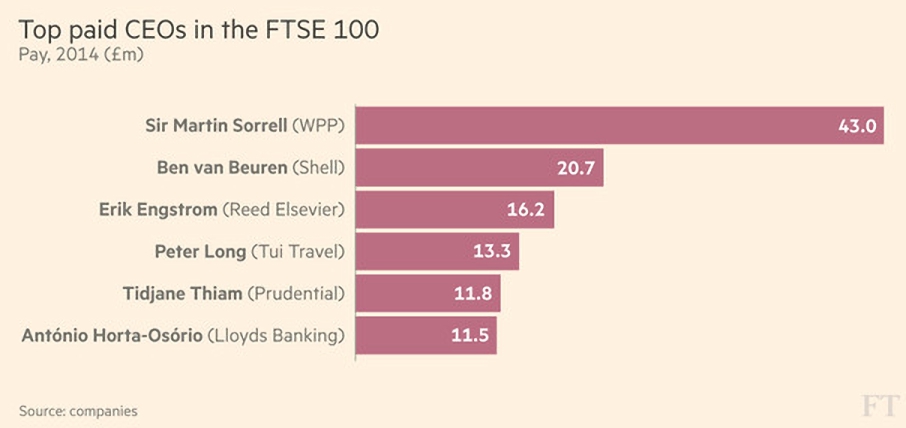
Plato reckoned that the pay ratio between the best and worst earners in a society should be five times. The average FTSE boss now earns 149 times the average worker, up from 120 times in 2009, and “only” 47 times in 1998.

The biggest gap is at WPP, where founder Sir Martin Sorrell earns £42.9M, or 810 times the salary of the advertising group’s average worker.
Pay ratios are calculated by dividing total employee costs by total employees, which hurts bosses of companies with lots of part-time workers, such as retailers – Next claim that Simon Wolfson’s ratio to full-time workers is only 212, not the 359 calculated by the High Pay Centre.
The next recession
![]()
The Economist was worried that the rich world is not ready for the next recession. In 2015, for the first time since 2007 every advanced economy is expected to expand. Rich-world growth should exceed 2%. But economies rarely manage a decade without recession, and America started growing in 2009.
The worry is that governments and central banks have already exhausted the tools at their disposal. Rich countries’ average debt-to-GDP ratio has risen by about 50% since 2007 (in Britain and Spain debt has more than doubled). Countries with limited access to bond markets (ie. the euro zone) will struggle to provide fiscal stimulus.
Monetary policy is even more cramped. The Bank of England’s base rate is still at 0.5%. Until 2009, it had never been below 2%. Futures prices predict only a return to 1.5% by 2018. In the euro zone and Japan rates are expected to remain near zero. There won’t be much room to boost economies by cutting interest rates.
It sounds like getting back to “normal” before the recession would be a good idea. But raising rates when wages are flat and inflation is low risks deflation and the recession they are ill-equipped to deal with. America has the strongest recovery and will lead the way, but not quite yet.
One thing that has been missing so far is government investment in infrastructure, which should boost growth. Open product markets and flexible employment law would also help with growth (and with the ability to cope with the next recession).
Wriggle room
To work out how much wriggle room countries have, the Economist calculated a composite measure of debt, deficits and interest rates.
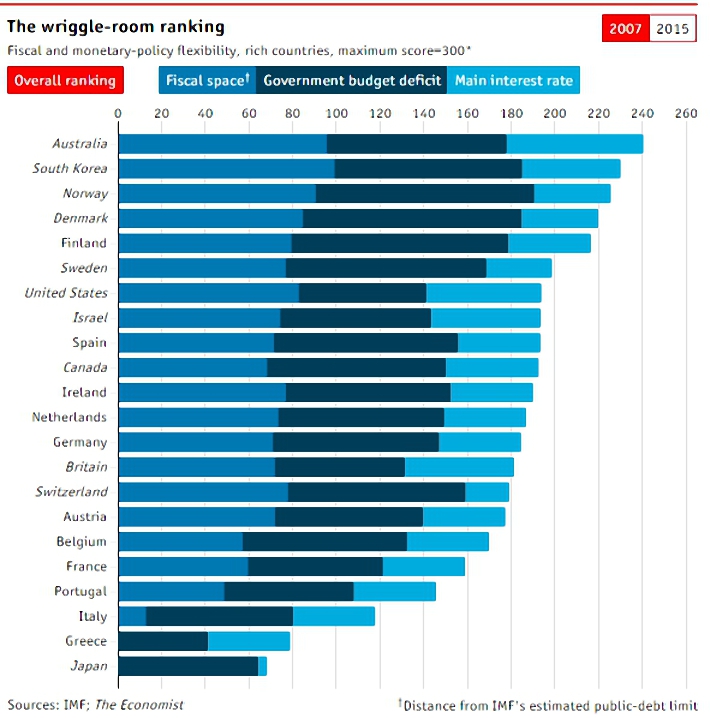
Their conclusion is that most economies are sitting ducks.
- For interest rates, they gave a value of 100 (maximum wriggle room) to rates of 10% or higher. At the start of 2007 the average rate was just under 4% – low by historical standards. It is now 0.3%.
- Government spending depends on access to bond markets. Ireland could not raise money when its deficit rose to 32% of GDP in 2010. This led to an EU bail-out. Ireland excepted, no deficit reached more than 16% of GDP.
- The wriggle room score therefore runs from 100 for a budget surplus of 5% or more, and 0 for deficits of 15% or more. The average deficit in 2015 is predicted as 2%, down from 6% in 2010. Before the crisis, the average was a small surplus.
- Debt as a share of GDP is 50% higher than before the crisis. The Economist gave a wriggle score of 100 to countries that, in the IMF’s view, could borrow a further 250% of GDP or more and 0 to those (Greece, Italy and Japan) than can borrow little. Most countries score lower than in 2007.
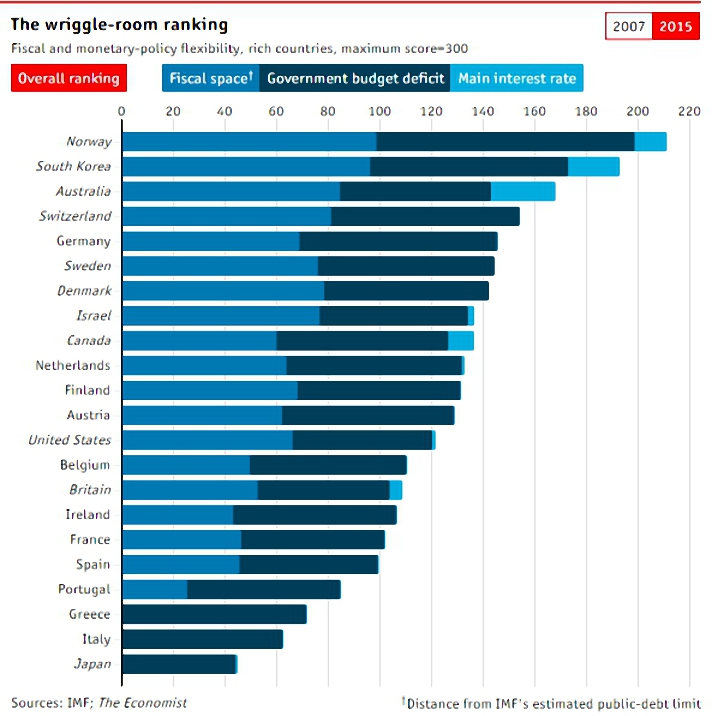
Over the three scores, Norway, South Korea and Australia come top. Their interest rates are above zero and they. Average wriggle room has fallen by a third since 2007. Italy and Spain have lost nearly half of theirs.
Unfortunately, the real-world predictive power of these numbers is uncertain. Japan has continued to borrow despite a debt-to-GDP ratio of 183% even in 2007. Italy’s borrowing costs fell after 2012, as investors decided that the ECB would bail them out if necessary.
And QE is theoretically limitless: central banks can buy as many bonds as governments issue. This should eventually produce high inflation. Yet Japan’s central bank already almost 30% of the public debt, with no ill effects. Central banks seem to be able to create their own wriggle room.
Critique of the CAPE valuation
Jeremy Siegel, Finance Professor at the Wharton School, wrote to the newspaper to clarify his criticism of Robert Schiller’s CAPE (cyclically adjusted price-earnings ratio) model for valuing the stock market.
Siegel’s point is that the earnings series used by the CAPE has changed substantially since the model was developed 20 years ago. “Mark-to-market” accounting was introduced in the 1990s, greatly increased the volatility of reported earnings.
As evidence, Siegel cites the drop in reported earnings following the 2008 crisis. This was much higher in percentage terms than the equivalent fall in the Depression, a slump that was five times greater in size.
Not correcting for the change in accounting methodology has lead to a significant overstatement of the CAPE ratio. This in turn means that the model under predicts stock returns.
There have been only nine months since January 1991 when the CAPE ratio has been below its mean (signalling undervaluation), whereas in all but six months since 1981 the realised ten-year returns from stocks have exceeded the CAPE forecasts.
The CAPE methodology signalled the US market as “overvalued” in May 2009, when the S&P 500 Index was 920 (vs. 2084 today).
This is all down to time-inconsistent data, not the model. When time-consistent corporate earnings are used ((Siegel mentions those published in the national income accounts)) the predictive power of the CAPE improves. The stock market also does not appear nearly as overvalued.
Corporate pension deficits
The Investors Chronicle took a look at corporate pension deficits. As we discussed a few weeks ago, the costs of pension schemes to companies (and therefore to their shareholders) are at historic highs, and are not always well-disclosed.
During 2015, around 2,000 private sector companies will have to agree a new 3-yr deal with their pension trustees, who are legally bound to act in the interests of current and future pensioners.
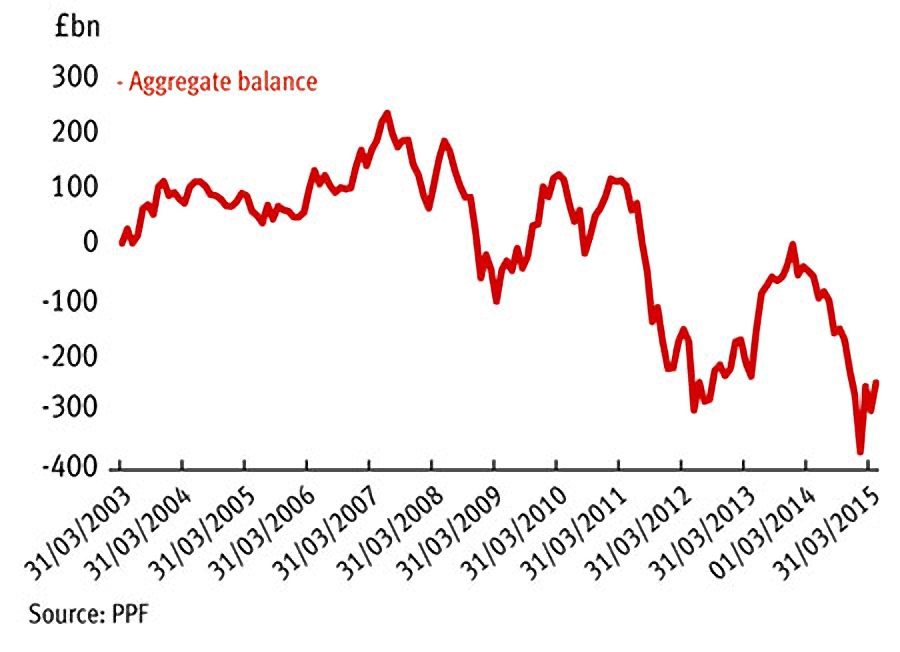
The decline in gilt yields, used to calculate the cost of future pension promises, guarantees that liabilities and deficits will increase. Many employers have predicted a return to more ‘normal’ gilt yield levels that will bring down their contributions, but there’s no sign of this yet.
The aggregate deficit of schemes eligible for the Pension Protection Fund (PPF) reached £242bn in April 2015, up from £49bn in 2014. ((In January 2015 the deficit peaked at £368bn)) Pension consultants Towers Watson estimates average contributions will increase by 30 per cent. ((Some companies will opt to extend their schedule of payments instead))
Management teams argue that allowing pension funding to impact dividends is self-defeating: if dividends are affected, the share price will be hit, reducing the strength of the employer. A weaker employer can then be required by the Pensions Regulator to provide increased contributions – a vicious cycle.
A better option may be to extend the existing recovery plan. Some plans now extend out as far as 25 years. Companies also try to structure the scheme to put larger payments in later years. They are also beginning to provide assets other than cash to their pension schemes.
Many employers are looking to offload future risk in their (closed) DB schemes to insurance companies. But this can only be done when the scheme is in a good state.
For investors, the real difficulty comes in working out to what extent the bad news about pension deficits is already in the share price.
The simple accounting deficit shown in company accounts – the gap between assets and liabilities – may not give the full picture. Payments use the industry regulator’s ‘technical provisions’ deficit. This is often based on gilt yields rather than those of corporate bonds, making things seem even worse.
Investors have a couple of options:
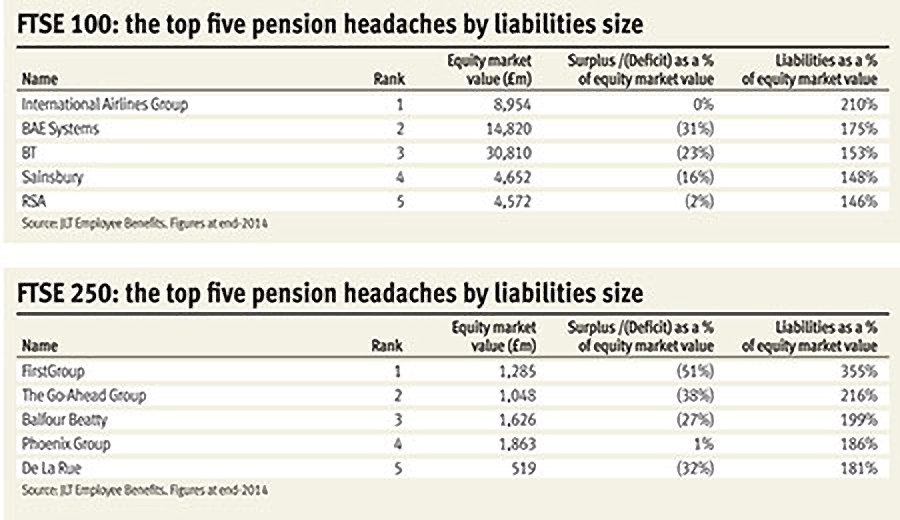
- they can track stocks with large pension liabilities relative to market cap (see tables)
- or they can track stocks with the worst funded schemes – those with the biggest percentage gap between assets and liabilities.
Leading this second list are Mondi (MND), with 41% funding, and Sage Group (SGE), with 56% funding.
JLT Employee Benefits maintains a list of companies most affected by pension deficits:
- in 2014, BAE Systems (BA.) was top of the list, with a balance sheet gain of £945M – 6% of market cap
- Royal Mail (RMG) would have been the biggest loser, but its pension liabilities were transferred to the taxpayer when the company was floated
- instead J Sainsbury (SBRY), came bottom, with an unforeseen loss of 7% of market cap
- in the FTSE 250, Serco (SRP) did best (unforeseen £30M / 3% gain)
- Mitchells & Butlers (MAB) took a £222m (14%!) loss
Aga Rangemaster (AGA) is probably the most famous victim of a pension deficit. The company made a £4.1m payment in 2014, and payments will reach £10M pa from 2016. The company also made an undertaking at its last triennial revaluation “not to make dividend payments without pension scheme trustee agreement”. Its deficit is £72m, compared to a £78m market cap.
El Nino and the bond market

Finally, over in MoneyWeek, John Stepek looked at the possibility that El Nino might topple the bond market.
El Niño is a weather phenomenon involving prolonged warming of parts of the Pacific, which leads to unusual and extreme weather across the world. The Australian Bureau of Meteorology thinks we’re in for a big one this year.
A recent paper from Cambridge economists Paul Cashin, Kamiar Mohaddes and Mehdi Raissi, looks at the impact of El Niño from 1979 to 2013. There is disruption to agriculture (in Australia, Indonesia and New Zealand), and higher crop prices, but globally, El Niño is good for growth, pushing up oil prices.
In the US it produces wet weather in California, warmer winters in the Northeast, and fewer tornadoes and hurricanes, boosting GDP. Other beneficiaries are Thailand, Mexico, China and Japan.
It also drives inflation higher, which could be the trigger for a bond market sell-off. Equities and commodities could be safer places to shelter from the weather this year.
Until next time.
Mike Rawson
Mike is the owner of 7 Circles, and a private investor living in London. He has been managing his own money for 40 years, with some success.